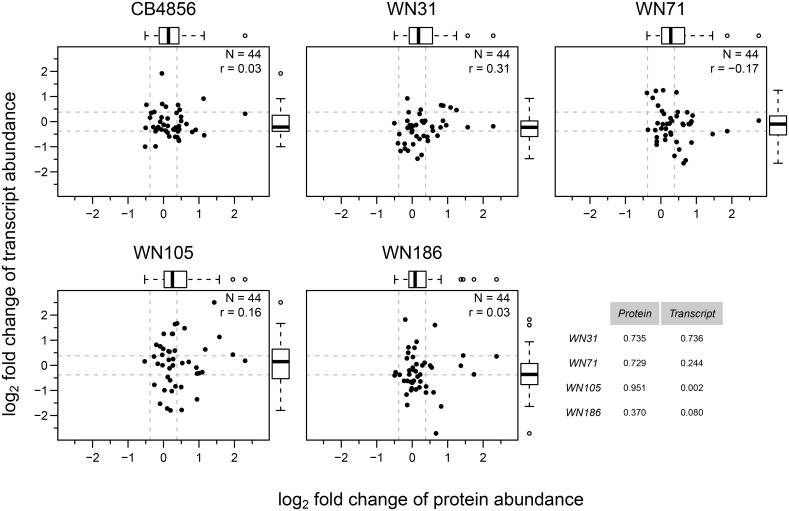
Fig 4. RILs show similar protein and transcript abundance variation for the tested 44 genes as the parental strains.
Comparison of protein and transcript abundance (log2 scaled fold changes relative to N2) for 44 signalling pathway proteins in CB4856 and four selected RILs. Horizontal and vertical dashed lines represent the fold change cut-off of 1.3 (~ 0.38 on log2 scale). Tukey-style box plot on top and right side represents variability in protein and transcript log2 fold changes respectively. Pearson correlation coefficient is denoted by r. Table on bottom right represents the P-values from the Fligner-Killeen test for homogeneity of variances between protein (column 1) and transcript (column 2) data for RILs compared with CB4856.

