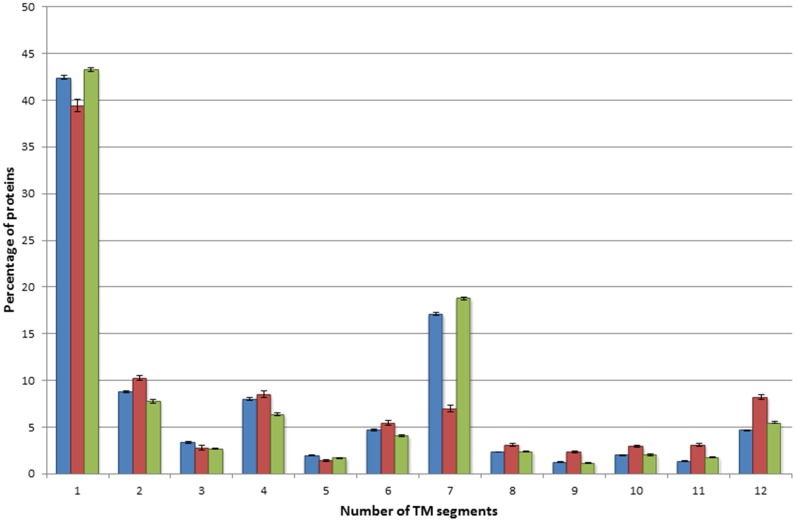
Fig 1. Distribution of genetic variations across transmembrane proteins.
Blue bars represent proteins from the Human Transmembrane Proteome database, red bars represent TMPs containing disease-associated mutation(s), green bars represent TMPs containing polymorphism(s). TMPs with more than 12 TM segments were not included in the figure because of the low number of those proteins.

