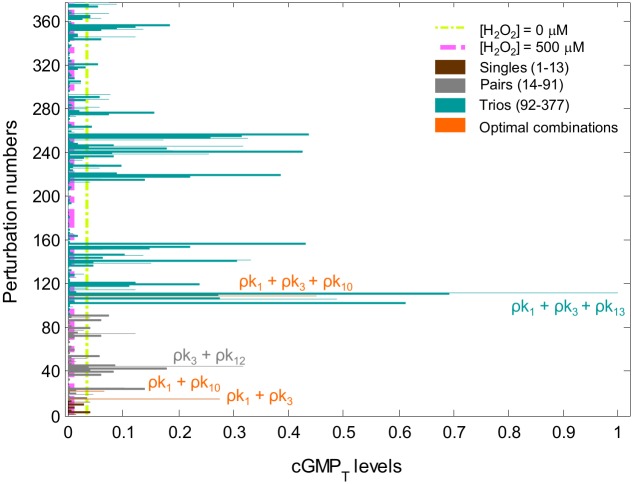
Fig 3. Relative cGMPT levels after single, paired, and triple kinetic perturbations of the oxidatively impaired NO˙-cGMP pathway.
The relative level of cGMPT as a function of all possible single (13 brown bars), paired (78 gray bars), and triple (286 green bars) perturbations is shown. Values of the rate constants were reduced to 10% of their original values (S1 Table). Each bar shows the relative integrated cGMP levels over the period of simulation, or . Note that some of the optimal perturbations are highlighted in this figure.

