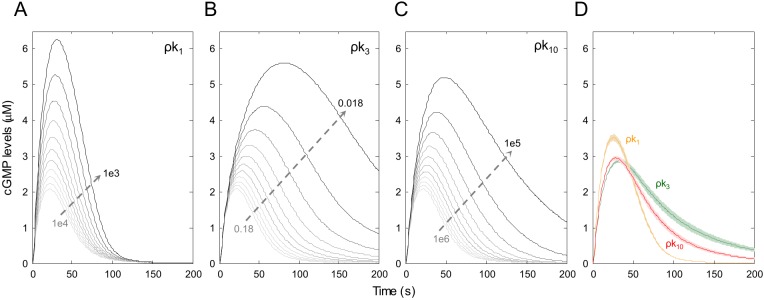
Fig 4. The effects of linear reduction of values for three individual rate constants on cGMP dynamics.
Using the linear reduction of values for k1, k3, and k10, we created a vector of eleven different values for each of these rate constants. We next generated three linearly spaced vectors for each of the rate constants by fractionally reducing each decrementally. Using these vectors of rate constants, cGMP dynamics were calculated. The cGMP levels after serial reduction of (A) k1, (B) k2, and (C) k3. (D) The relative cGMP levels. Data are shown as mean (dashed lines) ± S.E.M (shaded lines) of 11 simulated replicates. Note: k3 was the most sensitive parameter in cGMP accumulation as compared with k1 and k10. In addition, the highest cGMP levels were achieved at ~40 seconds.

