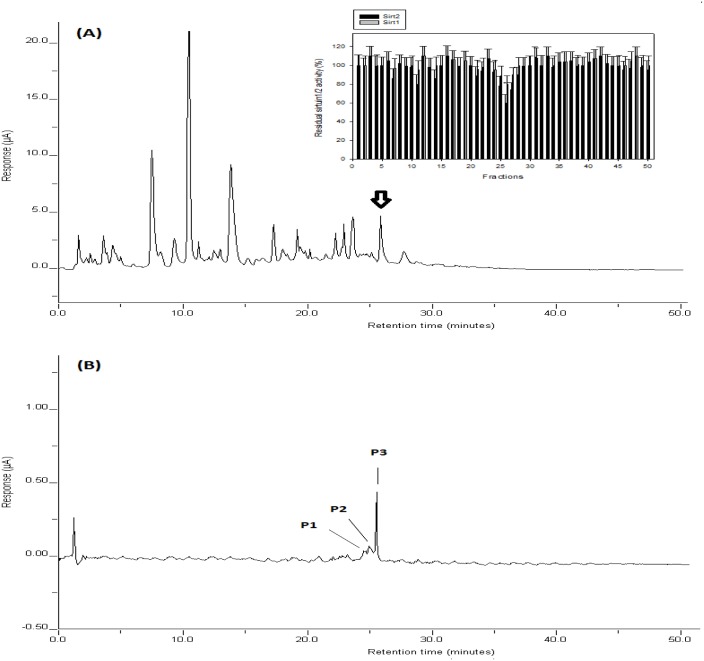
Fig 1. HPLC chromatograms of coffee samples.
Coffee samples were prepared and fractionated as described in “Materials and Methods”. The peaks were detected using an electrochemical detector. (A) Using HPLC fractions, Sirt1/2 inhibition assay (Insert) was performed as described in “Materials and Methods”. The marks (*) indicate statistical significance (P<0.05). (B) HPLC isolation of Sirt2 inhibiting compounds. Data are presented as mean ± SD (n = 6). P value was calculated using one-way ANOVA with Holm-Sidak method and the marks (*) indicate statistical significance (P<0.05).

