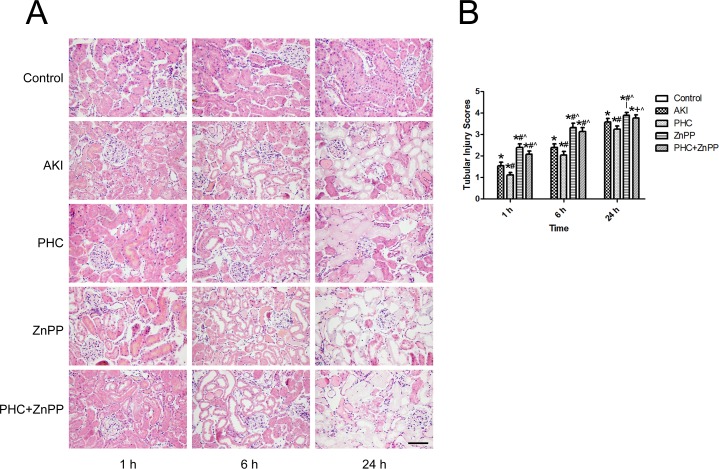
Fig 2. Evaluation of renal histopathology changes.
(A) Renal tissue sections were stained with H&E and photographed by a microscope (200×). Control group showed no injuries. In group AKI, flocular and vacuolar degeneration of renal tubular epithelial cells was observed at 1 h. Protein casts in renal tubular lumen, tubular dilation, loss of tubular epithelial cell brush borders, and cellular debris in the tubular lumen were observed at 6 h. Necrotic lysis of tubular epithelial cells and destruction of renal tissue structure were observed at 24 h. The pathological renal changes in group PHC were more moderate than those in group AKI, while the changes in group ZnPP and group PHC+ZnPP were more severe than those in group AKI. Scale bar corresponds to 100 μm. (B) Tubular injury scores of each group. The score of the control group was zero. Each bar represents mean ± SD. Compared with simultaneous group: * P<0.01 vs. Control; # P<0.01 or + P<0.05 vs. AKI; ^ P<0.01 vs. PHC.

