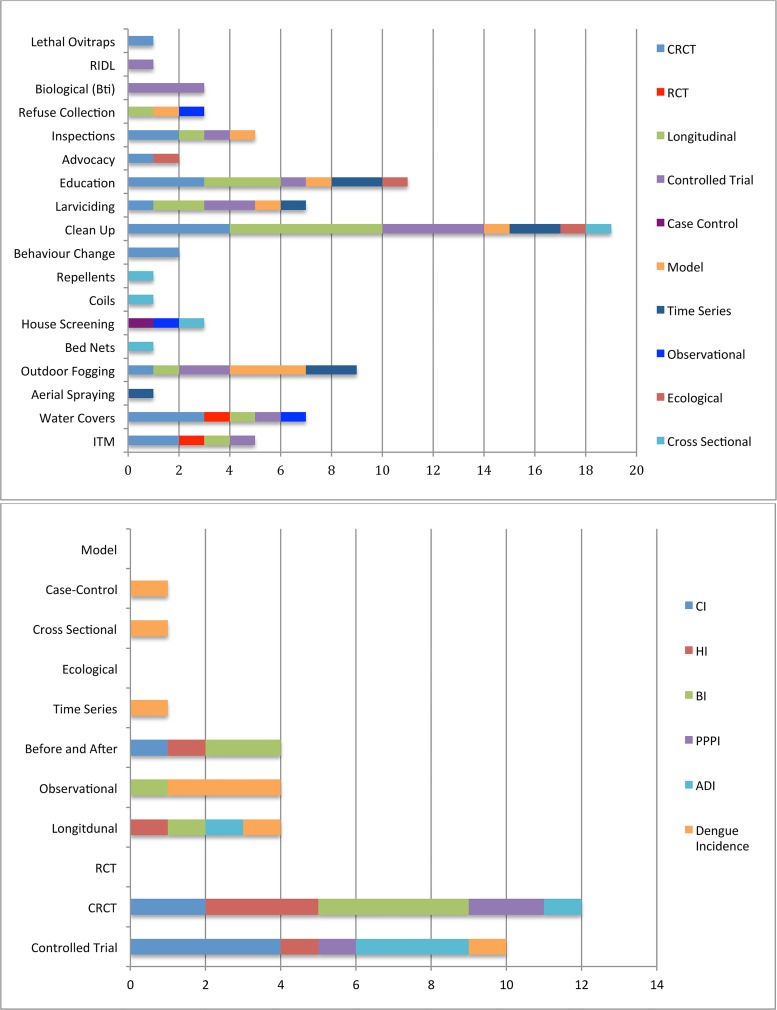
Fig 2. Summary of vector control tools and approaches.
Top: Histogram of frequency of interventions reported by the 41 studies, stratified by study design (note that a study design may have evaluated more than 1 intervention). Bottom: Histogram of frequency of reported reductions at p<0.05 stratified by study design (ADI = adult (mosquito) density index; CRCT = cluster randomised controlled trial).

