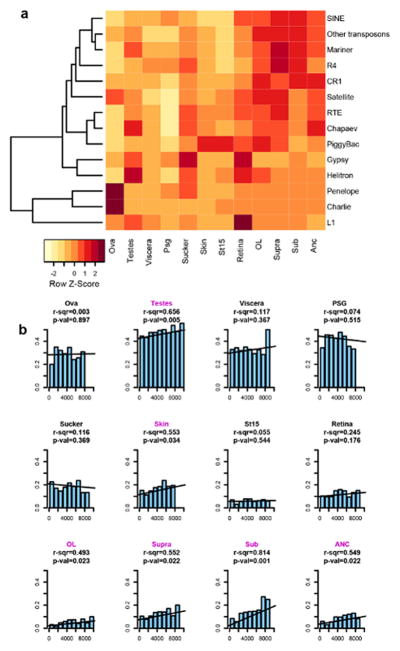
Extended Data Figure 8. Active transposable elements and gene expression specificity.
a, Transposable element expression across 12 tissues. b, Correlation between the total TE load (in bp) in the 5kb regions flanking the gene and the fraction of genes with tissue-specific expression (defined as having at least 75% of expression in a single tissue; Source Data: TELoadAndTissueExpression.xls). p-value indicates F-statistic for the significance of linear regression (H0: r-squared=0), with tissues with a p-value ≤ 0.05 indicated in pink.

