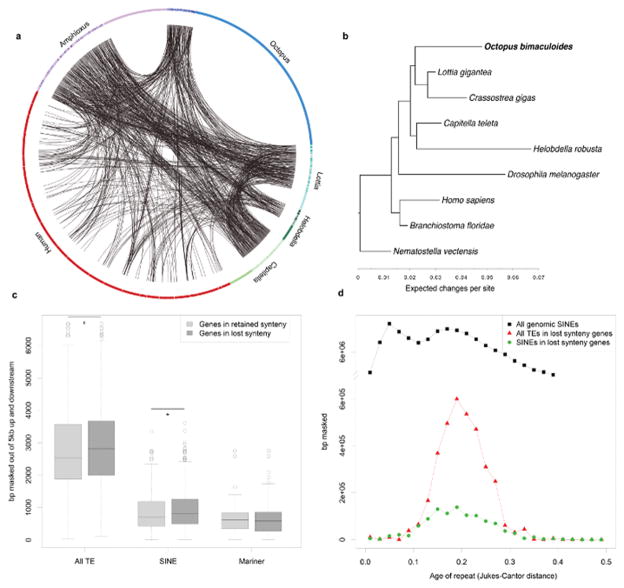
Extended Data Figure 9. Synteny dynamics in octopus and the effect of transposable element (TE) expansions.
a, Circos plot showing shared synteny across 6 genomes. Individual scaffolds are plotted according to bp length; scaffolds with no synteny are merged together (lighter arcs). Despite the large size of the octopus genome, only a small proportion of the scaffolds show synteny. b, Synteny reduction in octopus quantified based on synteny inference using gene families with at least one representative in human, amphioxus, Capitella, Helobdella, Octopus, Lottia, Crassostrea, Drosophila, and Nematostella. Drosophila, Helobdella, and Octopus show the highest synteny loss rates. Branch lengths, estimated with MrBayes55, reflect extent of local genome rearrangement (Supplementary Note 6). c, Enrichment of overall and specific TE classes (base pairs masked) around genes from ancient bilaterian synteny blocks, including those absent in octopus (see key). Asterisks indicates Mann-Whitney U test with p-value < 0.02. d, Transposable element insertion history (Jukes-Cantor distance adjusted, see text) into the vicinity of genes from ‘lost’ synteny blocks. Notice that only one SINE peak is present; a more recent peak (visible in “All genomic SINEs”) cannot be recovered from those insertions.

