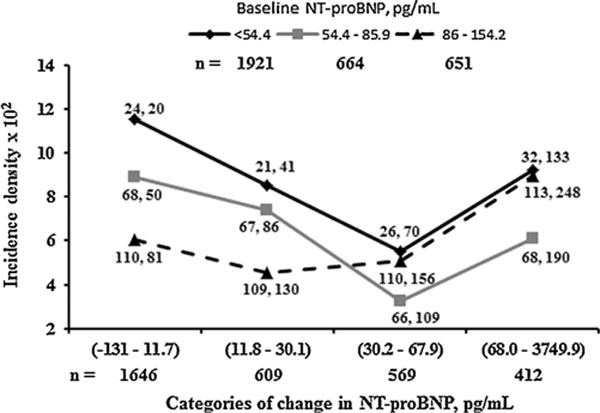
Fig. 3.

Graph showing adjusted diabetes incidence density from MESA visits 3 to 5 (6.3 years of follow-up) by categories of ΔNT-proBNP at different levels of baseline NT-proBNP in 3236 individuals with baseline NT-proBNP < 154.2 pg/mL and free of diabetes at or before visit 3. Diabetes incidence density: diabetes cases per 100 people followed for 6.3 years; n: number of individuals in each category. Categories of baseline NT-proBNP were low (<54.4 pg/mL), moderate (54.4–85.9 pg/mL) and high (86–154.2 pg/mL). Baseline NT-proBNP values > 154.2 pg/mL (n = 593) were deemed to represent predominantly cardiac pathophysiology (see main text). ΔNT-proBNP categories (range) on the x axis represent decrease/slight (−131–11.7 pg/mL), small (11.8–30.1 pg/mL), moderate (30.2–67.9 pg/mL) and large (>68 pg/mL) increases in NT-proBNP. Values are NT-proBNP medians at visits 1 and 3. The association between incidence density and categories of ΔNT-proBNP was adjusted for gender, race, age, highest educational level achieved, use of anti-hypertensive medication, total intentional exercise (MET-min/week) and IL-6. The association between incidence density and categories of change in NT-proBNP, adjusted for NT-proBNP categories at baseline, had a U-shaped pattern (P = 0.02).
