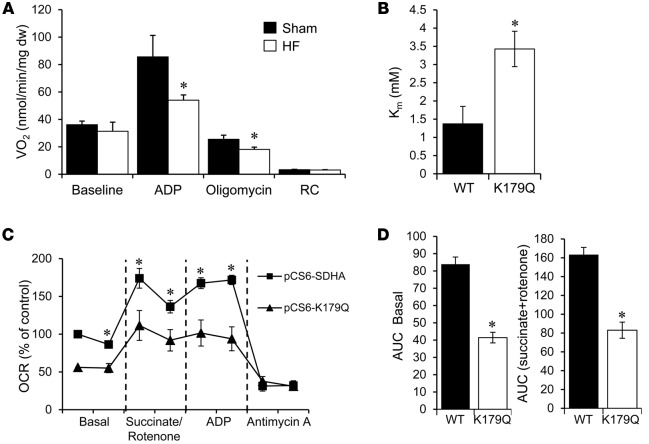
Figure 5. Evidence for acetylation effects on succinate dehydrogenase A function relevant to heart failure.
(A) Mitochondrial complex II respiration rates determined on cardiac muscle strips isolated from heart failure (HF) and sham-operated control mice using succinate (5 mM) as a substrate in the presence of rotenone (10 μM) to inhibit complex I flux. Basal, state 3 (ADP-stimulated), and post-oligomycin VO2 rates are shown normalized to mg dry tissue weight (mg dw). RC, respiratory control ratio (state 3/state 4). Bars represent mean respiration rates ± SEM (n = 5–11). *P < 0.05 compared to sham based on Student’s t test. (B) Succinate dehydrogenase A (SDHA) activity was measured in mitochondria isolated from HEK293 cells expressing WT SDHA (WT) or the acetyl-mimetic mutant (K179Q). Km was derived from measurements of initial velocity generated from a range of substrate concentrations using nonlinear regression. Bars represent mean values ± SEM (3 separate experiments each with n = 3/condition). *P < 0.05 compared to WT based on Student’s t test. (C) Oxygen consumption rates (OCRs) were measured in permeabilized NIH-3T3 cells transfected with either a vector encoding WT SDHA (pCS6-SDHA) or K179Q (pCS6-K179Q). The OCR was normalized to the total amount of SDHA in each sample, as quantified by Western blot. The graph shown is representative of 3 separate experiments, each with n = 10. Data points represent mean values ± SEM. *P < 0.05 compared to SDHA-K179Q based on Student’s t test. (D) Area under the curve (AUC) was calculated from the combination of all 3 individual experiments for basal and succinate-driven respiration (n = 30). Bars represent mean values ± SEM. *P < 0.05 compared to WT based on Student’s t test.

