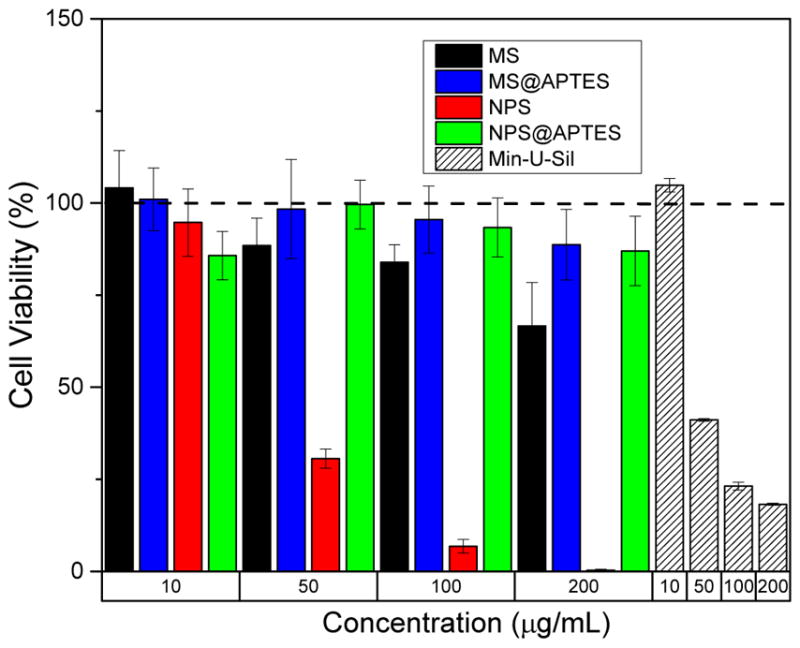
Figure 2.

Cell toxicity data in RAW 264.7 cells, 48 h post-exposure. The bare nonporous and mesoporous materials show both time- and concentration-dependent behavior. Min-U-Sil data, also at 48 h, is shown as the positive control for comparison. The data corresponding to 4 and 24 h post-exposure is available in the SI.
