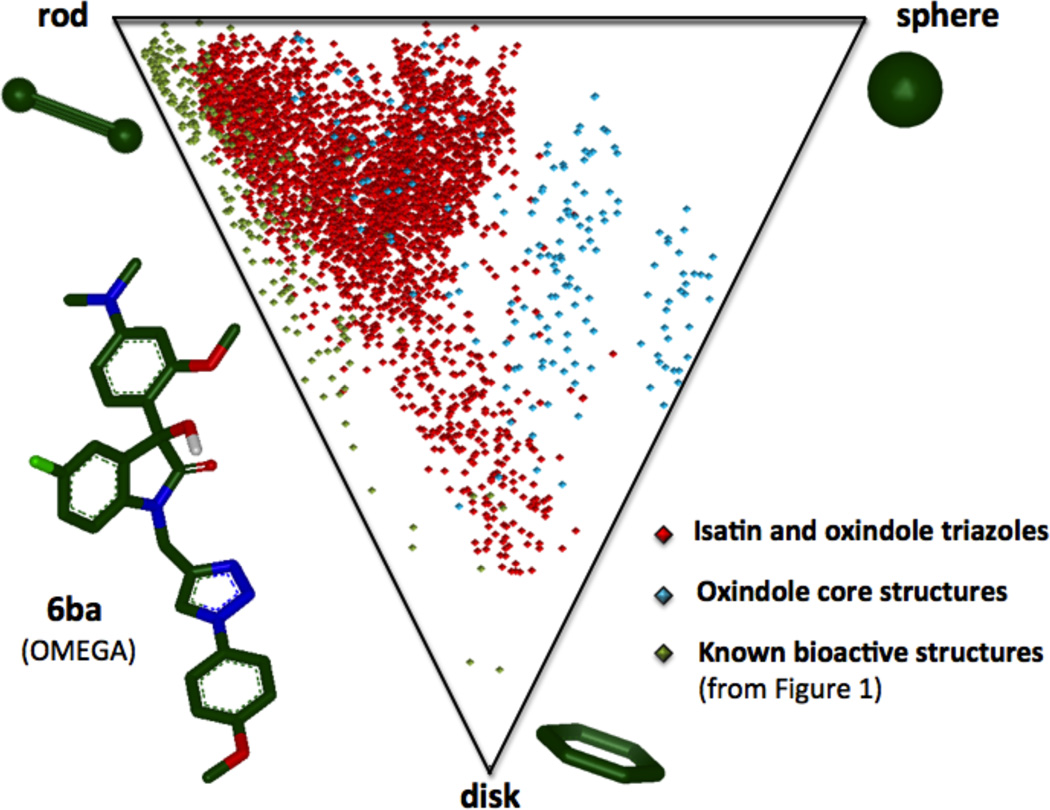
Figure 3.
Scatter plot with principal moments of inertia (PMI) ratios plotted to compare the molecular shape diversity of oxindole core structures (blue), triazole-containing isatins and oxindoles (red), and known biologically-active compounds from Figure 1 (green). For each compound, PMI ratios were calculated for all minimum energy conformers ≤3 kcal/mol from the global minimum.

