Fig. 3.
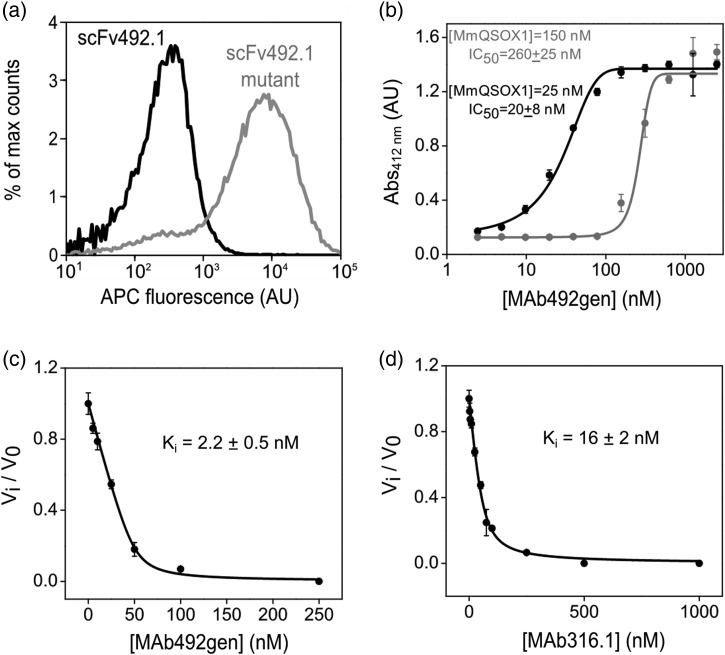
Evaluation of binding and inhibition constants of antibodies targeting MmQSOX1. (a) Histograms of fluorescence (APC-conjugated streptavidin) reporting MmQSOX1Trx binding to the surface of yeast displaying scFv492.1 or a scFv492.1 mutant (mutant d, Table I). Each histogram represents 50 000 yeast cells. The scFv492.1 mutant shows an increase in APC fluorescence compared with wild-type scFv492.1. (b) Dose–response curve of MAb492gen to 150 or 25 nM MmQSOX1, based on results from a colorimetric assay quantifying RNase A oxidation. The inhibitory activity is expressed as absorbance at 412 nm, representing free thiols that reacted with 5,5′-dithiobis-(2-nitrobenzoic acid). Error bars represent standard deviations from an average of three measurements. The IC50 values were determined by nonlinear regression analysis and yielded values close to the MmQSOX1 concentration. (c) Inhibition curve of MAb492gen to 50 nM MmQSOX1, based on results from oxygen electrode assays at a range of MAb492gen concentrations. Inhibitory activity is expressed as the ratio of the inhibited rate to the uninhibited rate (vi/v0). Error bars represent standard deviations from an average of three measurements. The Ki value was determined by nonlinear regression analysis. (d) Same as in (c), only for MAb316.1.

