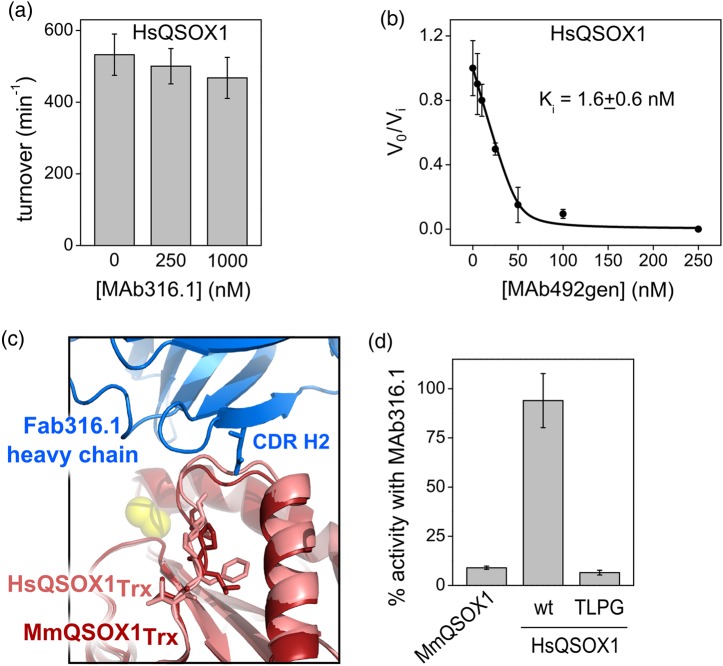
Fig. 7.
HsQSOX1 inhibition by MAb316.1 and MAb492gen. (a) Turnover numbers of HsQSOX1 in the absence and presence of 250 nM or 1 μM MAb316.1. Activity was evaluated using an oxygen consumption assay. Error bars represent standard deviations from an average of three measurements. (b) Inhibition curve of MAb492gen calculated from oxygen electrode assays of 50 nM HsQSOX1 in the presence of various MAb492gen concentrations. Inhibitory activity is expressed as the ratio of the inhibited rate to the uninhibited rate (vi/v0). Error bars represent standard deviations from an average of three measurements. The Ki value was determined by nonlinear regression analysis. (c) Superposition of HsQSOX1Trx (PDB ID: 4IJ3, chain a) and Fab316.1–MmQSOX1Trx complex (PDB ID: 5D93). Residues that differ in sequence between the two QSOX1Trx orthologs, namely the VFPV(135–138) loop from HsQSOX1 and the corresponding TLPG(138–141) loop from MmQSOX1, are in stick presentation. (d) The percent activity of MmQSOX1, HsQSOX1 and its mutant VFPV(135–138)TLPG, designated TLPG, in the presence of MAb316.1. Measurements were conducted in an oxygen consumption assay with 100 nM enzyme, 250 nM MAb492.1, and 200 μM DTT. Percent activity was calculated according to the results of the same measurements in the absence of antibody. Error bars represent standard deviations from an average of three measurements.

