Fig. 1.
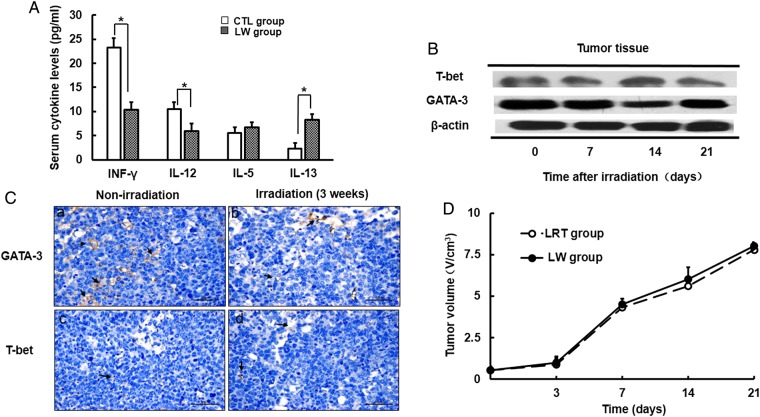
Characterization of Type-2 immune response in the tumor-bearing mouse model. (A) Differences in serum Type-1/2 cytokine levels between CTL group and LW group mice. (B) The expression of T-bet/GATA-3 in tumors before and after irradiation was measured by western blot. (C) T-bet and GATA-3 expression in tumors was detected by immunohistochemistry (magnification × 400). A representative picture is shown here. Arrows indicate positive expression. (D) Differences in tumor growth curves between LW group and LRT group mice. Data are shown as the mean ± SD. *P < 0.05. CTL group: healthy mice without any treatment; LW group: tumor-bearing mice without any treatment.

