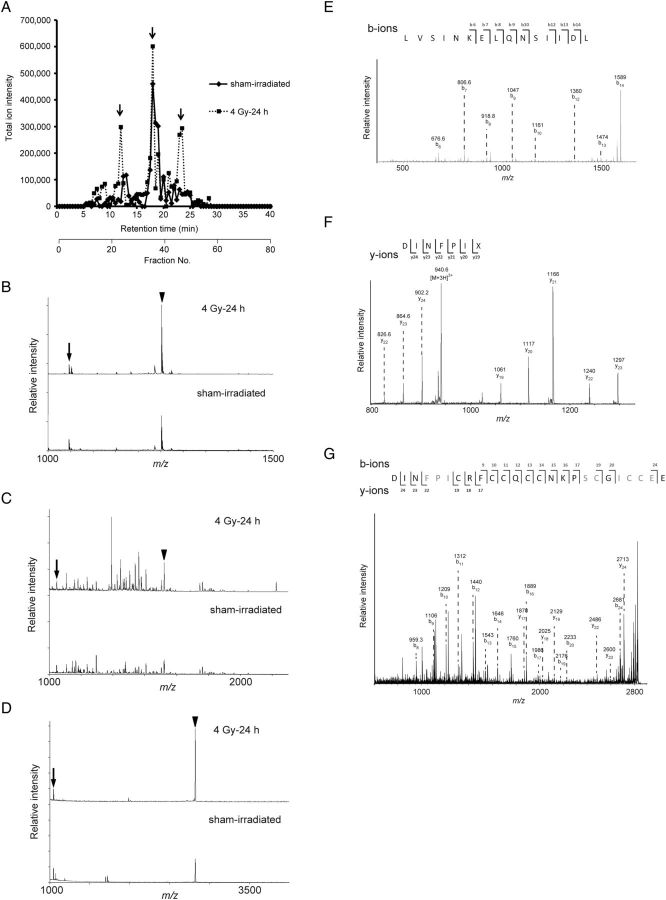
Fig. 1.
( A ) Representative total ion intensity in each fraction of mouse urine individually separated by high-performance liquid chromatography (HPLC): bold line, sham-irradiated; broken line, 24 h after 4 Gy irradiation. The sum intensity of each fraction is shown by retention time. Arrows show the changes in response to radiation. ( B , C and D ) Representative matrix-assisted laser desorption/ionization–time-of-flight mass spectrometry spectra of HPLC fractions no. 24, 35 and 46, respectively. The arrows represent the peak of angiotensin II ( m/z 1046) as the internal control, and the arrowheads represent m/z 1250 (B), 1721 (C) and 2821 (D), respectively. ( E ) Representative tandem mass spectrometry (MS/MS) spectra of m/z 1721 and (F) 2821. ( G ) Full MS/MS spectra of m/z 2821 were obtained from samples treated with dithiothreitol.

