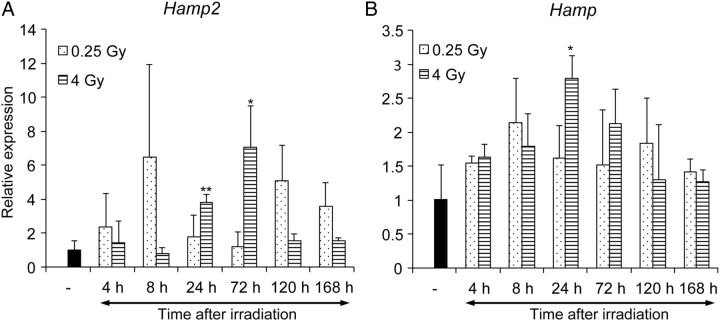
Fig. 4.
Expression of Hamp and Hamp2 genes in the liver after whole-body irradiation. We analyzed Hamp2 ( A ) and Hamp ( B ) expression levels with quantitative reverse transcription-polymerase chain reaction. We calculated the relative expression levels compared with the levels found in sham-irradiated mice. * P < 0.05, ** P < 0.01.

