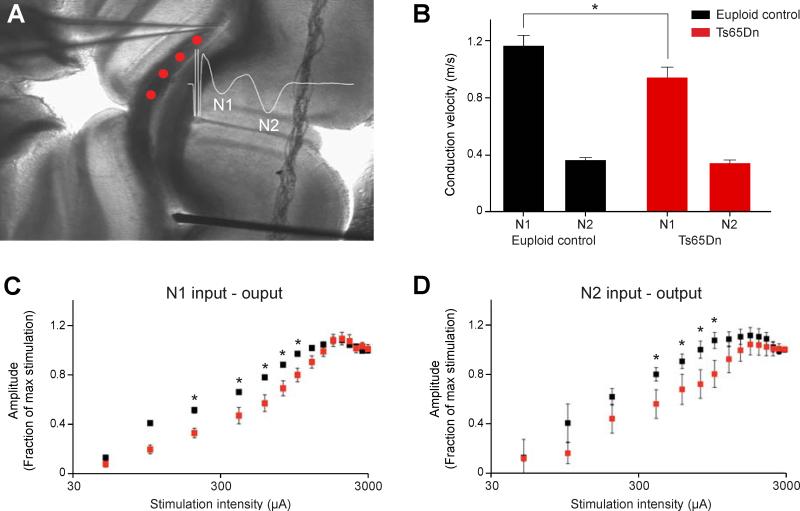
Figure 6. Slower Axonal Conduction in Ts65Dn Corpus Callosum.
(A) Experimental setup depicting the stimulating electrode (bottom) and recording electrode (top) within P30 corpus callosum of a coronal section. Compound action potentials (CAP) evoked by stimulation were recorded at multiple sites (red dots) to compute conduction velocity. Inset shows a representative example of an evoked CAP depicting the components arising from myelinated fibers (N1) and unmyelinated fibers (N2).
(B) Bar plot showing that conduction velocities for myelinated fibers (N1), but not unmyelinated fibers (N2), were significantly slower in Ts65Dn corpus callosum (*, p=0.04, n=10 for N1; n=11 for N2).
(C) The input-output relationship for myelinated fibers is right-shifted in Ts65Dn corpus callosum suggesting that this fiber type is less excitable (*, p<0.001 for N1 euploid n=5, Ts65Dn n=4).
(D) The input-output relationship for unmyelinated fibers is right-shifted in Ts65Dn corpus callosum suggesting that this fiber type is less excitable (*, p≤0.007 for N2; euploid n=5, Ts65Dn n=4).

