
Fig. 1.
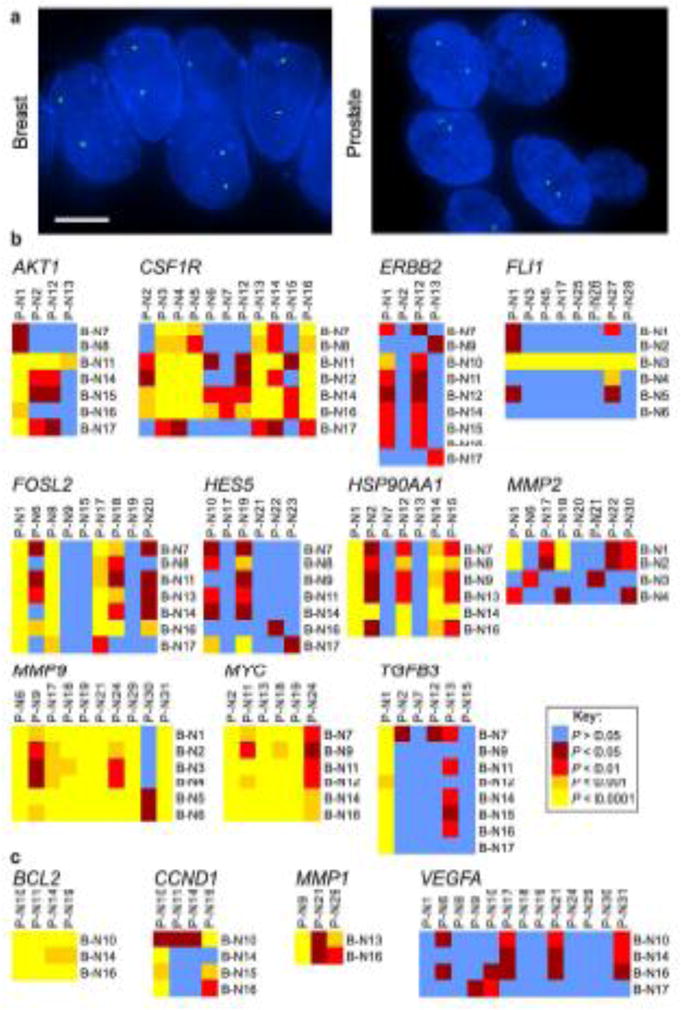
Tissue-specific spatial organization of the genome. (a) FISH was used to detect gene loci in FFPE tissue sections. FLI1 (green) in a normal breast tissue and HES5 (green) in a normal prostate tissue. Blue, DAPI nuclear counterstain. Scale bar, 5μm. Projected image stacks are shown. (b, c) Heat maps representing the pair-wise statistical comparisons of the positioning patterns of the indicated genes between normal breast tissues (B-N1 – B-N17; see Suppl. Tables S2, S3) and normal prostate tissues (P-N1 – P-N31; see Suppl. Tables S2, S3), using the two-sample 1D KS test. (b) Genes that reposition in either breast or prostate cancer (or both). (c) Genes that do not significantly reposition in either breast or prostate cancer. For these comparisons, the RRDs for AKT1, CSF1R, ERBB2, FOSL2, HES5, HSP90AA1, MYC, TGFB3, BCL2, CCND1, MMP1 and VEGFA in normal breast tissues are from (Meaburn et al. 2009) and the RRDs for FLI1, MMP9, MMP2, BCL2, CCND1, MMP1 and VEGF in prostate tissue are from (Leshner et al. 2015)