
Fig. 4.
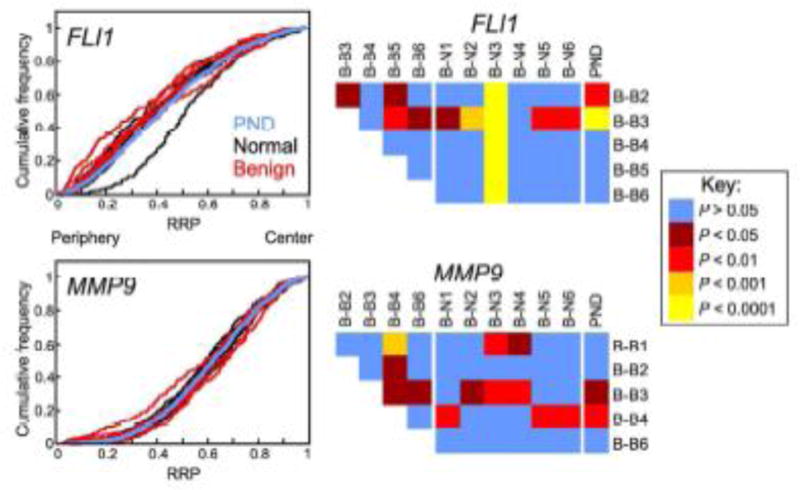
Gene positioning in non-malignant disease resembles normal tissue. Positions of indicated genes were compared between benign breast disease (hyperplasia: B-B1-B-B3; fibroadenoma: B-B4-B-B6; see Suppl. Table S2) and normal breast tissue (B-N1 – B-N6). Left-hand panel: Cumulative RRDs for the indicated genes in benign (red), normal tissues (black) and the pooled normal distribution (PND; blue). Right-hand panel: Pairwise statistical comparisons of RRDs between benign and normal tissues and amongst benign tissues, using the two-sample 1D KS test. RRP, relative radial position