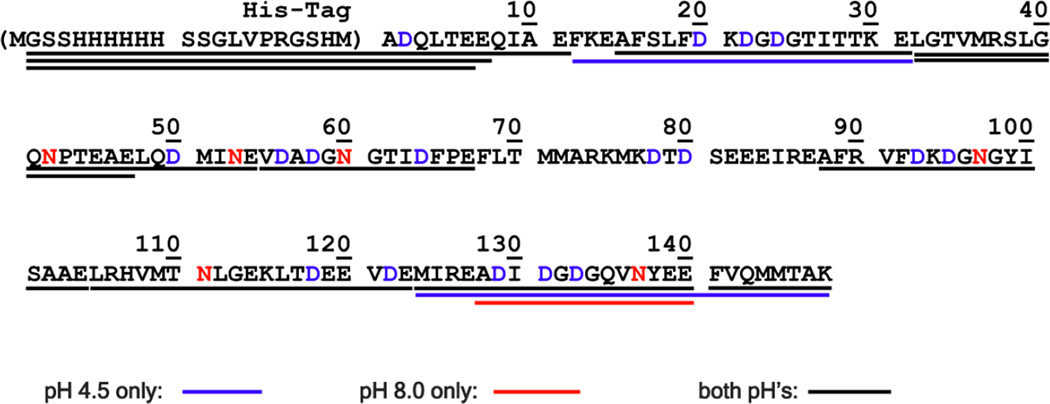
Fig. 6.
Sequence coverage of calmodulin by Glu-C proteolysis. Color codes indicate peptides observed at digestion at pH 4.5 only (blue), at pH 8.0 only (red) and at both pH’s (black). The peptides between F68 and E87 were not observed by MALDI. Sequence coverage was found to be 88% and 87% at pH 4.5 and 8.0 respectively

