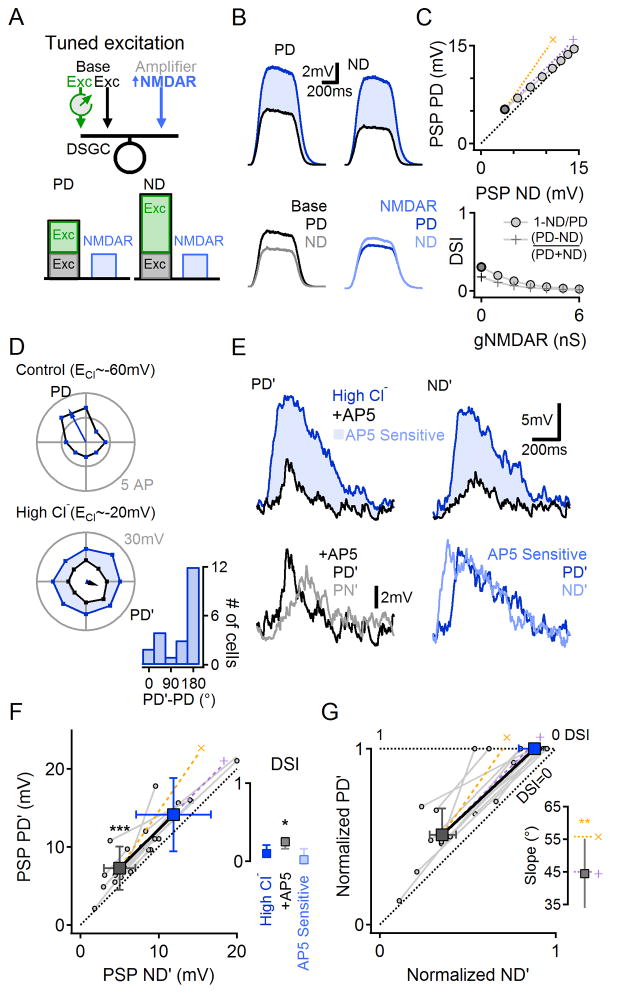
Figure 4. NMDARs-mediated scaling is additive when excitation is directionally tuned.
(A) Schematic of numerical simulation (similar to that shown in Figure 3) of a DSGC receiving directionally tuned excitatory GABAergic drive (Erev=−20mV), untuned excitatory glutamatergic/cholinergic drive (Erev=0mV) and no inhibition.
(B) Simulated responses, as in Figure 3E,H.
(C) As in Figure 3F,I. Simulated NMDAR conductance scaled PSPs additively (top), leading to decreased DSI (bottom).
(D–E) Experiments in which GABAergic input was rendered excitatory by elevating intracellular [Cl−].
(D) Top, Suprathreshold directional tuning (cell-attached, i.e., native Cl−i). Bottom, Subthreshold tuning from the same cell after dialysis with high-Cl− intracellular solution (blue). Black, following bath application of AP5. Inset, the shift in PD’ with high-Cl− internal relative to PD measured in the cell- attached configuration.
(E) Top, PSPs in response to PD’ and ND’ stimuli. Bottom, AP5-insensitive (black, left) and -sensitive (blue, right) components. The AP5-sensitive component was not directionally tuned.
(F) PD’ vs. ND’ PSP amplitudes from 12 cells before and after bath application of AP5. Population mean (±SD, squares) follow the predicted additive scaling (‘+’, purple). Inset, Median (±quartile) DSI after intracellular dialysis with elevated chloride solution, and the AP5-insensitive (+AP5) and AP5-sensitive components of the PSP.
(G) Data in (F) normalized to the control PD response in the corresponding DSGC. Inset, Slopes of NMDAR-mediated scaling were significantly different from the multiplicative prediction (**p<0.01, z-test) and similar to the expected additive scaling. See also Figure S8 for further explanation about why tuned excitation leads to additive scaling.

