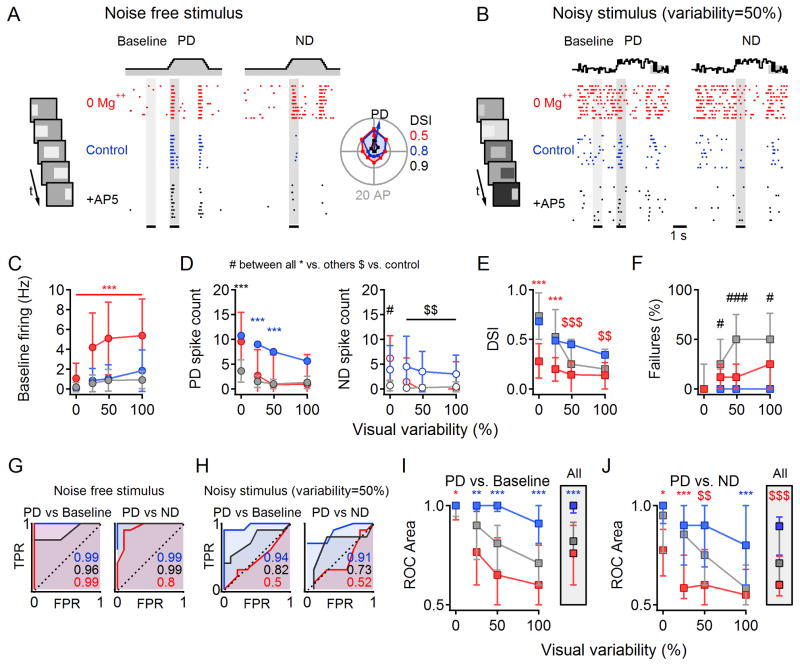
Figure 8. Multiplicative scaling improves output fidelity in noisy visual conditions.
(A) Raster plot of spikes in one DSGC (n=10 repetitions) in response to PD (left) and ND (right) stimuli in 0 Mg++ ACSF (‘0 Mg++’, red), after addition of 1mM Mg++ (‘Control’, blue) and subsequent addition of 50 μm AP5 (‘+AP5’, black). Color scheme applies to the entire figure. Top, schematic time course of noise-free illumination. Inset, left, Schematized movie frames of the standard visual stimulation protocol. Inset, right, DS tuning of responses. Calculated DSI values indicated color coded by the condition.
(B) As in (A) for noisy stimulation conditions in which the luminance of the background and stimulus (bar) changed independently between frames with similar mean levels as (A) and SD of 50% of the mean.
(C) Baseline firing rate as a function of visual noise. Here and below statistical analysis was conducted within individual noise levels with ANOVA followed by multiple comparison Tukey test. Statistical significance color coded as in (A).*p<0.05,**p<0.01,***p<0.001 vs. other conditions, #p<0.05,###p<0.001 between all conditions, $$p<0.01,$$$p<0.001 vs. control).
(D) Average spike count (± SD) during PD (left) and ND (right) stimulation.
(E) DSI (median ±quartile) is reduced by noise in all conditions, but the reduction is more pronounced in 0 Mg++.
(F) Failure rate (the percentage of trials with PD firing below baseline firing level).
(G) ROC analysis of responses in (A) at times indicated by the grey regions.
(H) As in (G) for the data shown in (B).
(I) Median (±quartile) area under ROC plots for PD vs. baseline histograms as a function of visual noise. Inset, Area under ROC for responses averaged over all noise levels.
(J) As in (I) for PD vs. ND responses.

