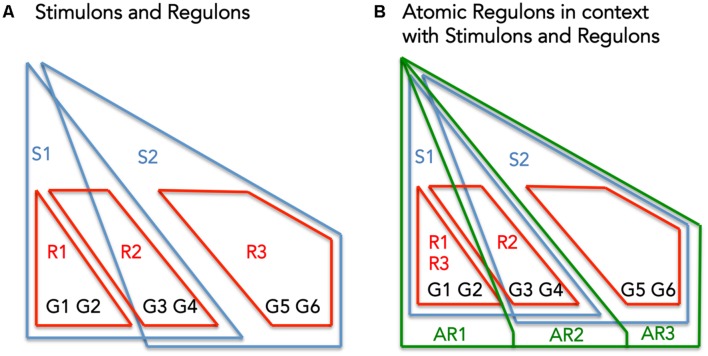
FIGURE 1.
The interplay between Stimulons, Regulons, and Atomic Regulons (ARs). (A) The representation features six genes (G1–G6), three regulators (R1–R3), and two stimuli (S1–S2). The red lines define the regulons and the blue lines define the stimulons. (B) Features in addition to (A): the Atomic Regulons (AR1–AR3) in the representation as sets of genes that have identical binary expression profiles.

