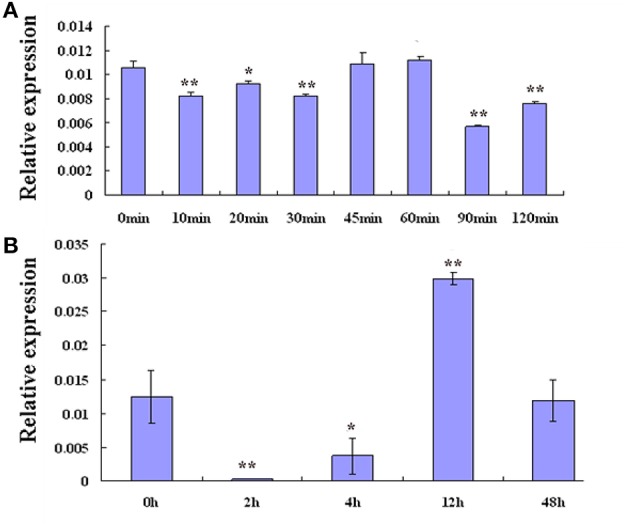
Figure 3.

The expression pattern of GmZFP3 in soybean roots under PEG6000 (20%) and 100 μM ABA treatments. (A) The expression pattern of GmZFP3 in soybean roots under 100 μM ABA for 10, 20, 30, 45, 60, 90, or 120 min. (B) The expression pattern of GmZFP3 in soybean roots under PEG6000 (20%) for 2, 4, 12, or 48 h. *p < 0.05 level; **p < 0.01.The relative expression level at Y axis indicates the expression of GmZFP3/GmActin.
