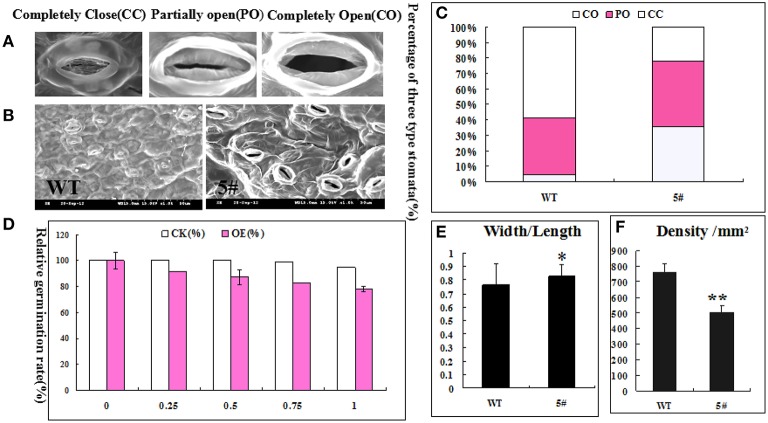
Figure 7.
The relationship between transgenic plant ABA-induced drought sensitivity and stomata. (A) Environmental scanning electron microscopy images of three stomatal levels. (B) Scanning electron microscopy images of transgenic line #5 and wild-type. (C) The percentage of the three types of stomatal opening in transgenic line #5 and wild-type. (D) The germination rate of transgenic line #5 and wild-type (WT) under different ABA concentrations. (E) The stomatal width/length in transgenic line #5 and wild-type. (F) The stomatal density in transgenic line #5 and wild-type. Significant difference at *P < 0.05 and **P < 0.01 level.

