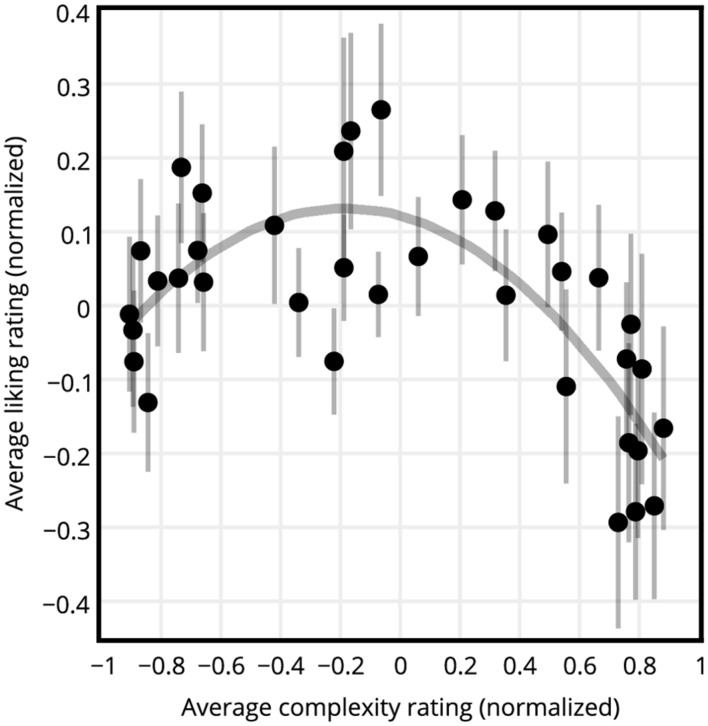
FIGURE 3.
Liking versus complexity ratings of all participants. All ratings are normalized averages across all shapes and participants. Dots represent the stimuli, and the line represents a quadratic function fit. Error bars show standard error of mean. An inverted U-curve relationship between liking and complexity is visible.

