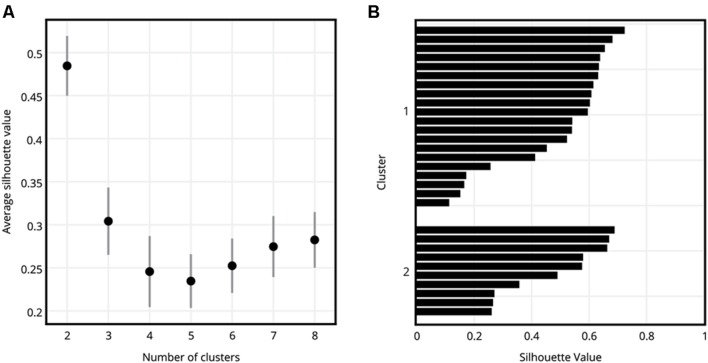
FIGURE 5.
Evaluation of grouping of participants into different numbers of clusters. (A) Average silhouette values of clusters for k = 2, 3, 4, 5, 6, 7, and 8. Error bars show standard error of mean. k = 2, where the participants were divided into two clusters, had a significantly higher average silhouette value than the remaining numbers of clusters. (B) Silhouette value distribution of participants as they were assigned to Cluster 1 and Cluster 2, where k = 2.

