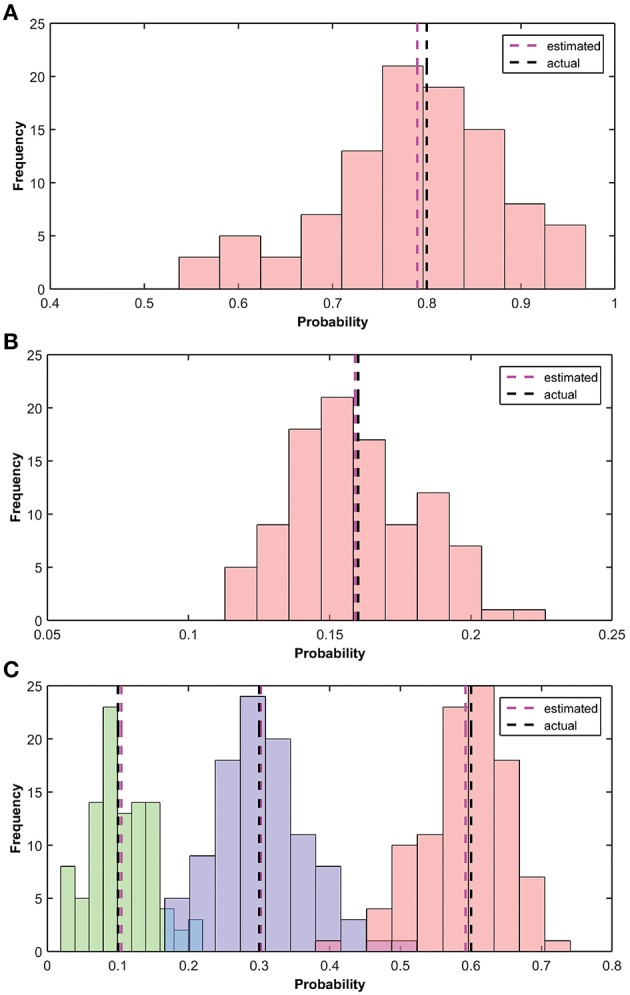
Figure 10.

Estimation of α, β and the transitional probability. (A) Histogram of the estimated observation probability (α) is shown using pink bars. True (0.8) and average estimated (0.79) observation probabilities are shown using black and pink dotted lines, respectively. (B) Histogram of the estimated parameter αβ is shown using pink bars. True (0.16) and estimated (mean) parameter αβ (0.159) are shown using black and pink dotted lines, respectively. (C) Histogram of the estimated transition probabilities [Left, Stay, Right] of 100 different simulations are shown in [Green, Blue, Pink], respectively. True transition probability [0.1, 0.3, 0.6] and estimated (mean) transition probability [0.105, 0.302, 0.59] are shown using black and pink dotted lines, respectively.
