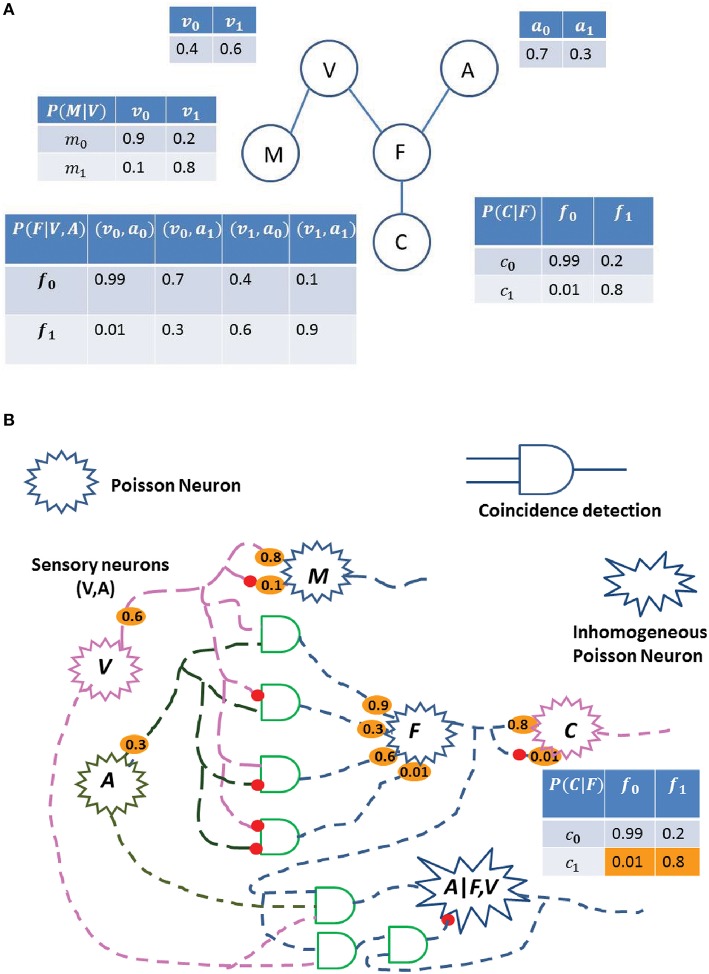
Figure 3.
Probability estimation in a simplified Bayes network. (A) A predator uses visual cues (V) to find a mate (M), and both visual (V) and auditory (A) cues to find food (F). C is the event of catching the food, F. Each table represents the probability of the event. Some of the events are conditional on other events, such as event (F) depends on (V) and (A). The subscript 0 with the variable represents the probability of the absence of the event, while the subscript 1 represents the probability of the event. For an instance, P(f1|v0, a1) = 0.3 means that the probability of finding the food given the auditory cue and absence of the visual cue is 0.3. (B) Possible neural circuit corresponding to the Bayes network shown in (A). Each Poisson neuron represents a different random variable (Visual, Audition, Food, Catch, and Mate), and each synaptic connection is associated with the emission probabilities of a spike [non-spiking probability is 1-(spike probability)] shown in orange, and is related to the probability tables of (Figure 6). The probability of a variable can be inferred from the multivariate joint distribution by taking multiple samples and considering only samples when spike occurs for that variable. By the law of large numbers, the estimation of the variable will be close to the true value. For an instance, circuit to compute the probability of variable A given F and V is shown.

