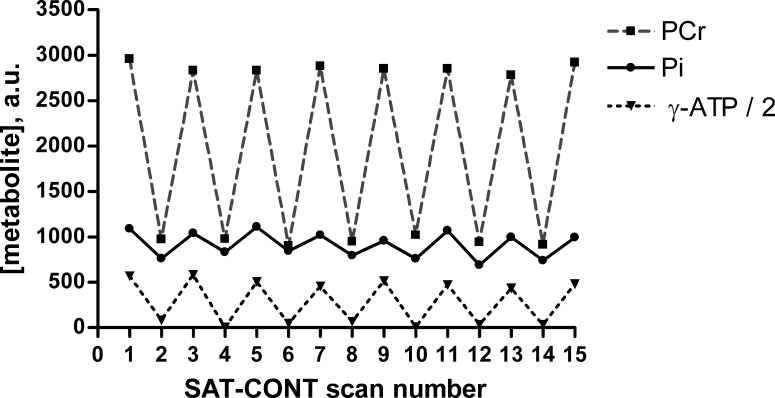
Fig. 2.
Individual time course of metabolite concentrations obtained during steady-state exercise with alternating γ-ATP and control irradiation. Representative (group B volunteer) metabolite concentration time course of PCr (squares), Pi (circles), and γ-ATP (triangles), obtained during steady-state exercise conditions with alternating frequency of saturation (SAT-CONT section in Fig. 1). Each x-axis point corresponds to a single spectrum. Even scan numbers correspond to spectra obtained with saturation of γ-ATP (SAT) and odd scan numbers to the equivalent control saturation frequency equidistant to Pi (CONT). Consecutive points are joined by gray dashed (PCr), solid black (Pi), and dotted black (γ-ATP) lines to aid visualization.

