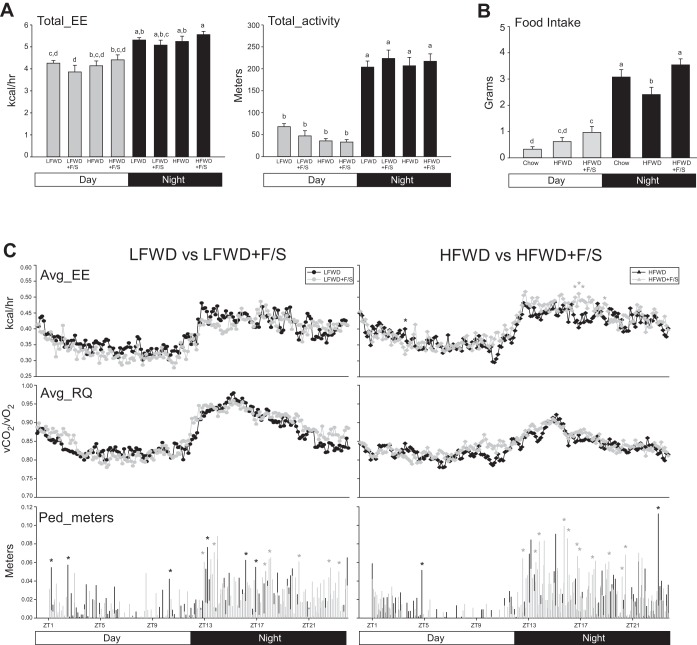
Fig. 1.
Metabolic phenotype at 2 wk. A: mean ± SE circadian analysis of total energy expenditure (Tot_EE) (left) and total activity (right) for day and night phases over a 48-h period in mice fed low-fat Western diet (LFWD), high-fat Western diet (HFWD), LFWD+F/S (sugary drink - fructose and sucrose), or HFWD+F/S. B: circadian analysis of food intake in chow, HFWD, and HFWD+F/S groups. A and B: different letters indicate significantly different values at P < 0.05. C: means ± SE of average energy expenditure (Avg_EE), average respiratory quotient (Avg_RQ), and pedestrian meters (Ped_meters) every 8 min during the 24-h period for LFWD vs. LFWD+F/S (left) and HFWD vs. HFWD+F/S (right) groups. Black stars, significant increases (P < 0.05) in LFWD and HFWD groups over LFWD+F/S and HFWD+F/S groups (left and right, respectively); gray stars, significant increases (P < 0.05) in LFWD+F/S and HFWD+F/S groups over LFWD and HFWD groups (left and right, respectively).

