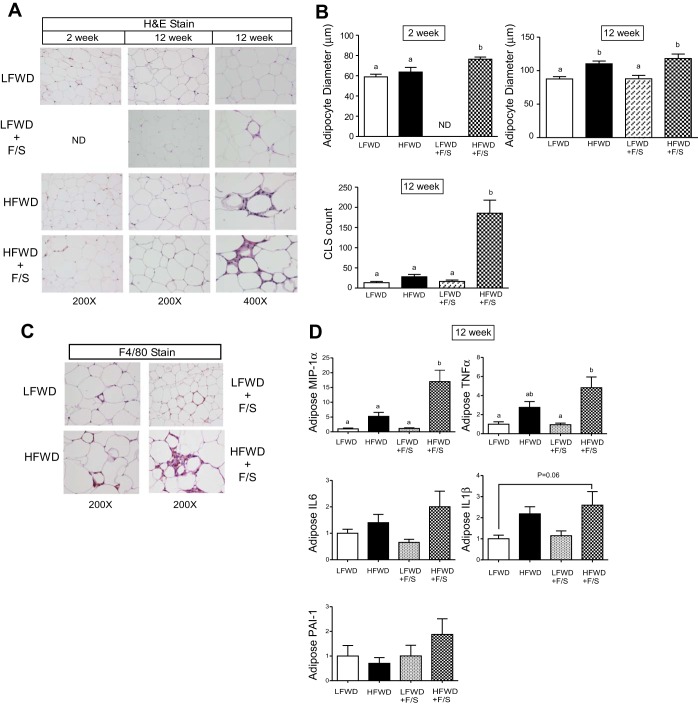
Fig. 11.
eWAT inflammation and adipocyte size. A: H&E-stained adipose tissue sections at 2 and 12 wk. Shown are representative images at ×200 left and middle) and ×400 (right). B: quantitation of adipocyte size (top) and crown-like structures (CLS) (bottom) are shown as means ± SE at 2 and 12 wk. C: F4/80-stained eWAT macrophages at 12 wk. D: normalized gene expression of eWAT proinflammatory genes and fold changes (means ± SE) relative to LFWD at 12 wk. Different letters indicate significantly different values at P < 0.05. ND, not determined.

