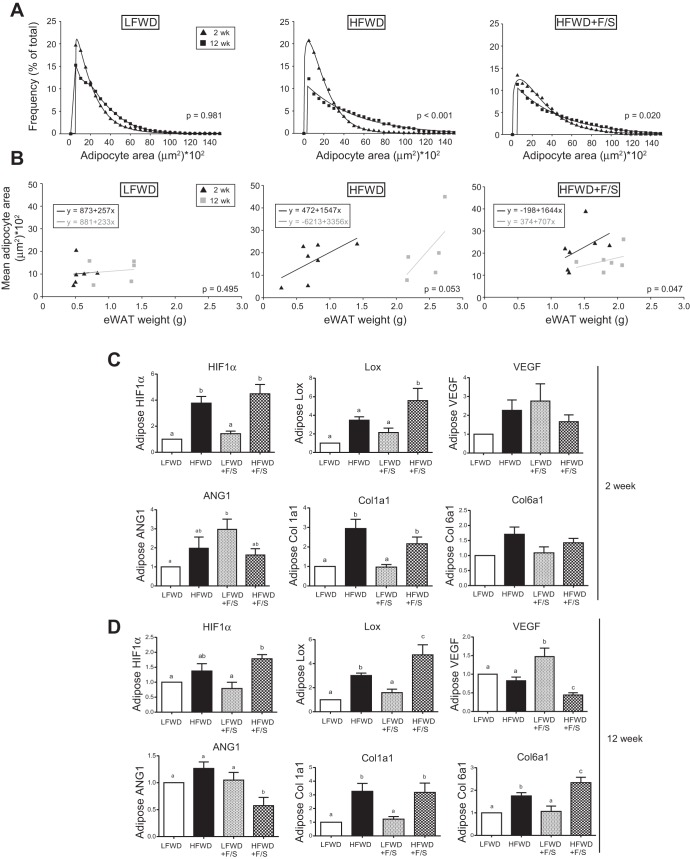
Fig. 12.
eWAT adipocyte size distribution and fibrosis and angiogenesis gene expression. A: frequency of adipocyte area from 0 to 1,500 μm2 in increments of 500 μm2 is shown as the mean at 2 and 12 wk. P values for the Kolmogorov-Smirnov test for sample distribution are shown. B: relationship between mean adipocyte area and eWAT weight at 2 wk (black triangles) and 12 wk (gray squares). Linear regression was performed separately for samples collected at 2 wk (black lines) and 12 wk (gray lines). Line equations and P values for differences in slopes are shown. C: normalized gene expression of eWAT fibrosis and angiogenesis genes and fold changes (means ± SE) relative to LFWD. Different letters indicate significantly different values at P < 0.05.

