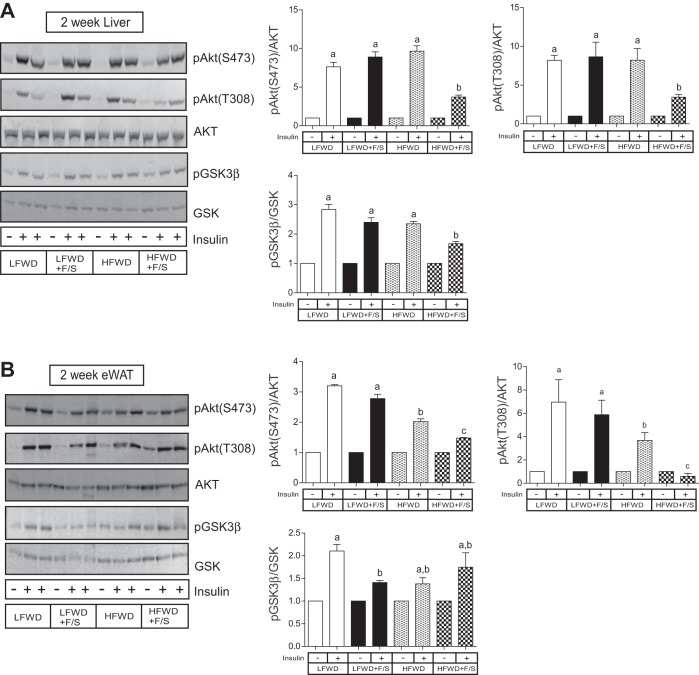
Fig. 5.
Hepatic and adipose insulin signaling at 2 wk. A and B: insulin-stimulated hepatic Akt Ser473 (S473), Akt Thr308 (T308), and GSK3β Ser9 (pGSK3β) phosphorylation, total Akt, and GSK3β representative blots (A) and means ± SE (B) of insulin-stimulated LFWD-fed mice. C and D: insulin-stimulated adipose AktS473, AktT308, and GSK3β phosphorylation, total Akt, and GSK3β representative blots (C) and means ± SE (D) of insulin-stimulated LFWD-fed mice. AktS473 and -T308 phosphorylations were normalized to total Akt; GSK3β phosphorylation was normalized to total GSK. Different letters indicate significantly different values at P < 0.05.

