Fig. 9.
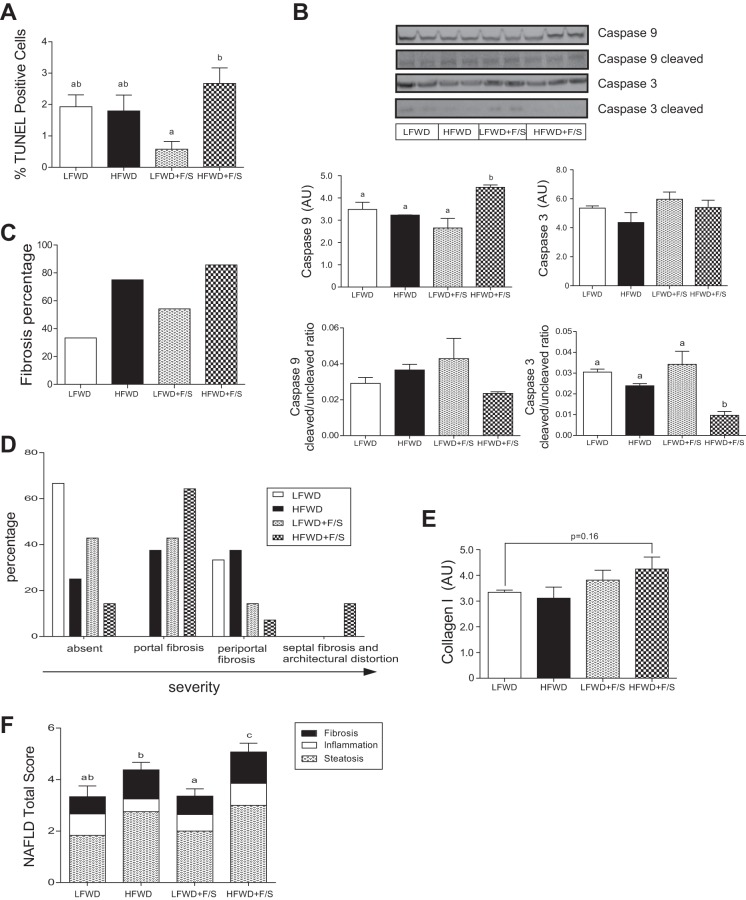
Markers of hepatic apoptosis, apoptosis-related protein expression, fibrosis, and fibrosis-related protein expression. A: TUNEL staining of liver is shown as mean ± SE at 12 wk. B: assessment of caspase cleavage. Representative immunoblots are shown (top) and quantitation of immunoreactive bands minus background is shown as means ± SE in AU (bottom). C: fibrosis scoring of Masson's trichrome-stained liver fibrosis section is shown as percentage by treatment groups. D: fibrosis scoring of Masson's trichrome-stained liver fibrosis section is shown as percentage by fibrosis location. E: collagen I expression. Quantitation of protein expression is shown as means ± SE in AU. F: NAFLD total score at 12 wk is shown as means ± SE. Different letters indicate significantly different values at P < 0.05.

