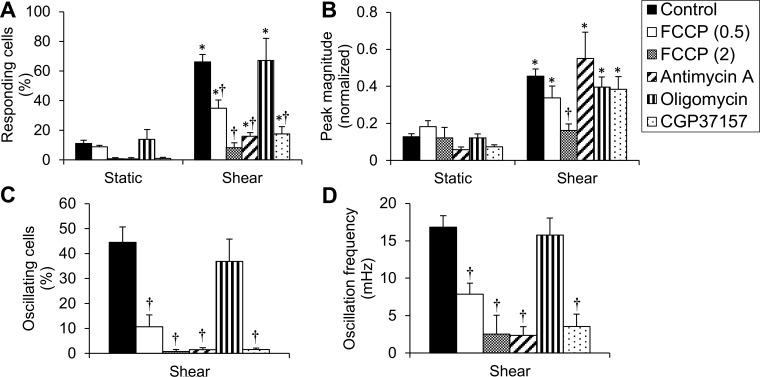
Fig. 6.
EC mitochondria regulate the shear-induced [Ca2+]i transients and oscillations. A: responding cells (%) throughout the (preshear) static period vs. the shear period for control, FCCP (0.5 or 2 μM), antimycin A, oligomycin, and CGP37157. B: peak magnitude of normalized fluorescence during static vs. shear for the same treatments as in A. C: oscillating cells (%) for the same treatments. D: oscillation frequency (mHz) for the same treatments. Data are means ± SE (n = 4–8 independent experiments). *P < 0.05 vs. static under the same treatment. †P < 0.05 vs. control.

