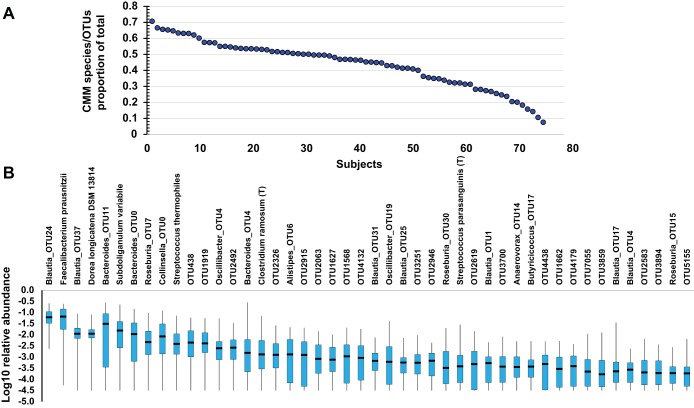
Fig. 1.
Distributions of the Core Measurable Microbiome (CMM) in subjects of the study. A: dot plot depicts the proportion of the combined CMM species/Operational Taxonomic Unit (OTU)-level abundances out of the total species/OTU-level abundances for each individual in the study. The individuals are arranged in decreasing order of CMM/total from left to right. B: standard box-and-whisker plot depicts the distribution of the abundances of each of the 46 individual species/OTUs comprising the CMM with 50% of the data (box), the range (whiskers), and the median (line in box), plotted on a log10 scale of the relative abundances.

