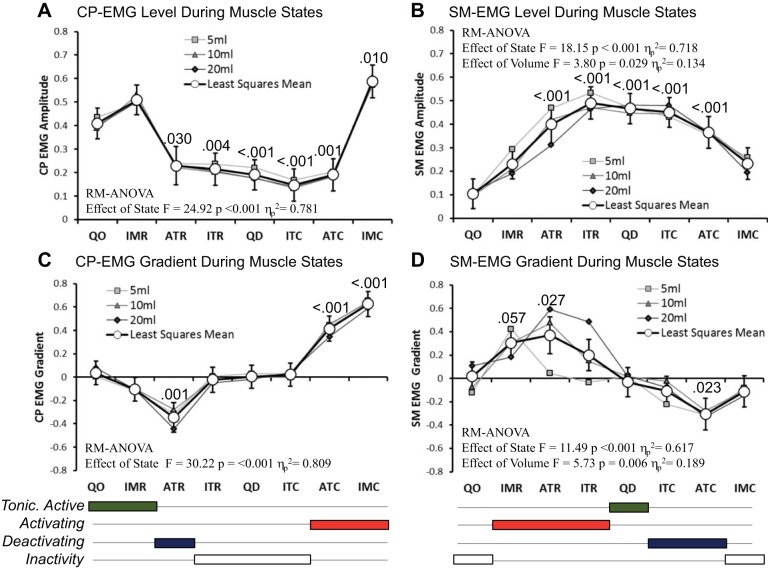
Fig. 5.
Normalized CP-EMG and SM-EMG activity recorded when different UES muscle states were predicted. A and B: EMG level, where higher values represent greater activity. C and D: EMG gradient, where positive/negative values indicate that EMG activity is increasing/decreasing with respect to time. Based on the EMG changes in these data with respect to mechanical state, conclusions were drawn with respect to the overall state of muscle activity present when the different muscle states were predicted. Below the graphs, the 8 states are consolidated into 4 groups defining when the muscle is tonically active (green), activating (red), deactivating (blue), or inactive (white). Graphs show the individual means for each state based on 5-, 10-, and 20-ml volumes and the overall estimated marginal mean for each state for all volumes combined (white circles with 95% confidence intervals). Repeated-measures (RM) ANOVA descriptive parameters are shown for each overall estimated marginal mean comparison. P values indicate pairwise significance vs. quiescent occluded (QO) state (post hoc test following Bonferroni correction). IMR, isometric relaxation; ATR, auxotonic relaxation; ITR, isotonic relaxation; QD, quiescent distended; ITC, isotonic contraction; ATC, auxotonic contraction; IMC, isometric contraction.

