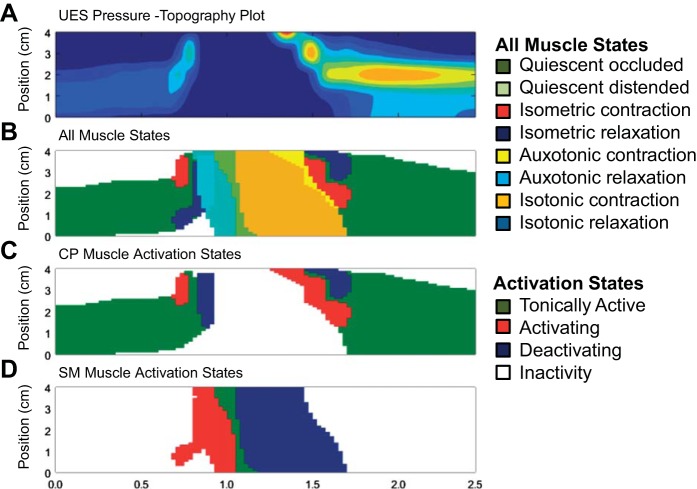
Fig. 6.
Generation of seamless maps of the spatiotemporal distribution of mechanical states (10-ml liquid swallow, previously shown in Figs. 2 and 3). A: pressure topography plot of the UES area of interest. B: muscle state map showing the appearance of 8 main muscle states over time. C: simplified muscle state map showing predicted CP muscle activity with states consolidated into 4 groups. D: simplified muscle state map showing predicted SM muscle activity with states consolidated into 4 groups.

