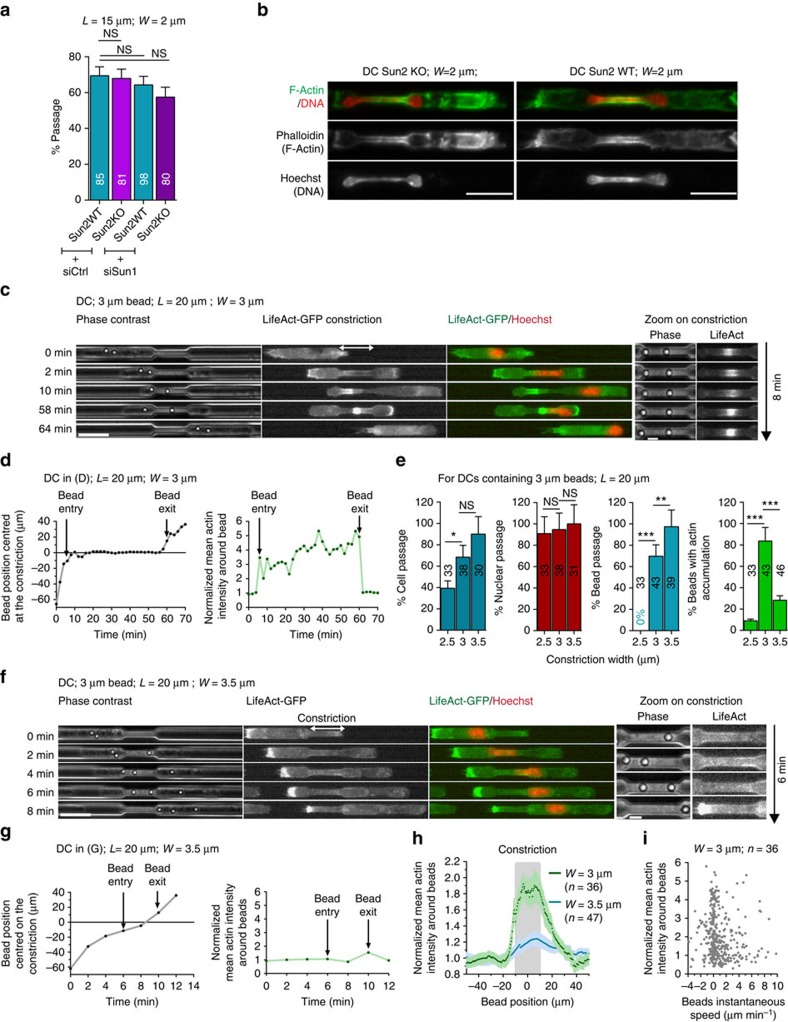
Figure 6. Actin assembly inside constrictions is not specific to the nucleus and can be induced by confinement of rigid particles.
(a) Percentage of passage in 2-μm-wide constrictions of DCs treated as indicated. Error bars are s.e.m. (b) Representative images of Sun2 KO (left) and Sun 2 WT (right) immunostained DCs in 2-μm-wide and 15-μm-long constrictions. N=2; scale bar, 15 μm. Sequential images of representative LifeAct-GFP (green)-expressing DCs with a 3 μm internalized bead stained with Hoechst (red) passing 3 μm (c) and 3.5 μm (f) wide constrictions. Scale bar 20 μm (c,f (left)); 5 μm (zoom). (d) Left: bead position centred at the constriction; (d) right: normalized mean actin intensity around the first bead of the cell shown in c over time. (e) For DCs with internalized beads, percentage of cells with F-actin accumulation around beads (‘Peribead'), percentage of cell, bead and nuclear passage as function of the constriction width (2.5, 3 and 3.5 μm). Numbers represent the number of cells observed for N=3. Error bars are s.e.m. (g) Left: bead position centred at the constriction; (g) right: normalized mean actin intensity around the third bead of the cell shown in f over time. (h) Normalized mean actin intensity around beads in 3- (green) and 3.5-μm (blue)- wide constrictions as a function of the bead centre of mass position relative to the centre of the constriction. Error bars are s.e.m. (i) Normalized mean actin intensity around beads as function of beads velocity in 3-μm-wide constrictions. L, constriction length; W, constriction width.. ***P-value<0.0001, **P-value<0.001 and *P-value<0.01. NS, nonsignificant. Statistical test: Fisher's test.

