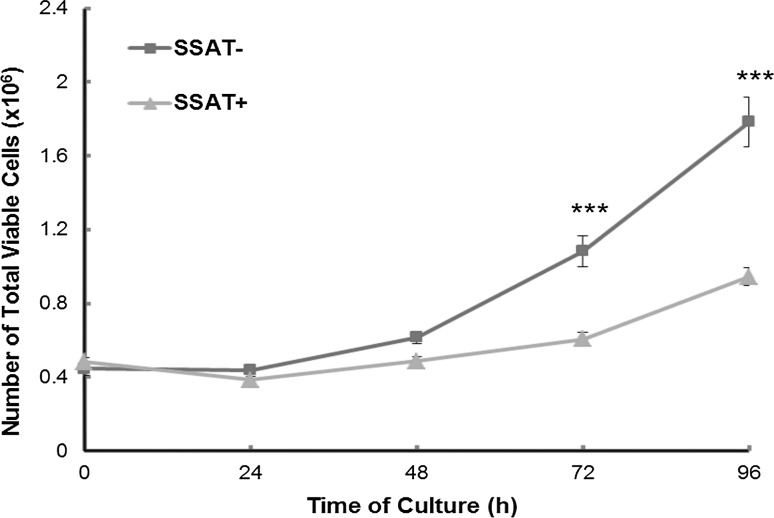
Fig. 2.
Growth of induced (SSAT+) and non-induced (SSAT−) cells. Cells were seeded at a density of 2.4 × 10⁴/cm2 in 60 mm cell culture dish in duplicate. Cells were harvested at 24 h intervals and viable cell numbers counted using Trypan blue exclusion assay. Results shown are mean ± SEM (n = 4–16, with 2 replicate per experiment). Statistical analysis was performed by two-way ANOVA using Prism 5. ***p < 0.001

