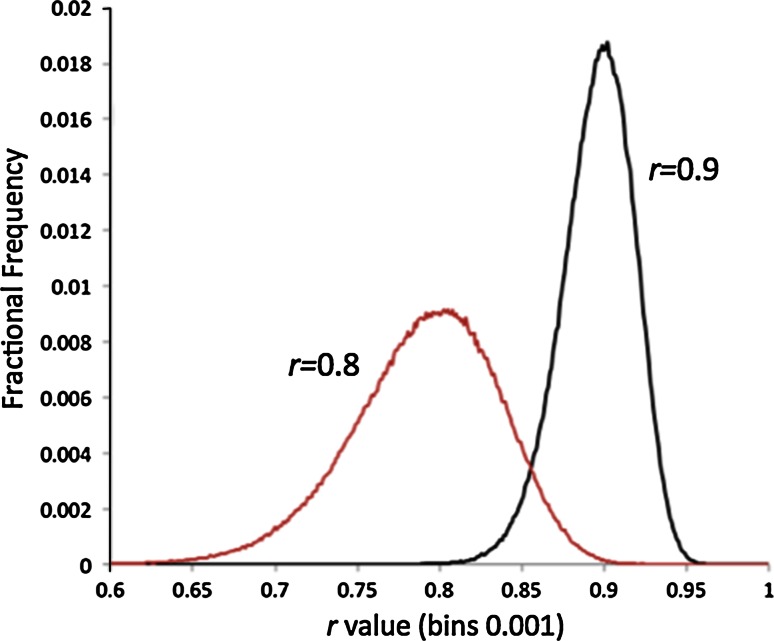
Fig. 4.
Distributions of r values with modal averages of 0.8 and 0.9. Graphs were produced by random sampling of the correlation coefficient of 50 points generated by Eq. 32, where the x coefficient was evenly spaced between 0.0 and 4.0. Graphs are made from 106 independent simulations of Eq. 32, with γ = 0.595 for r peaking at 0.9 and γ = 0.925 for r peaking at 0.8

