
Figure 1.
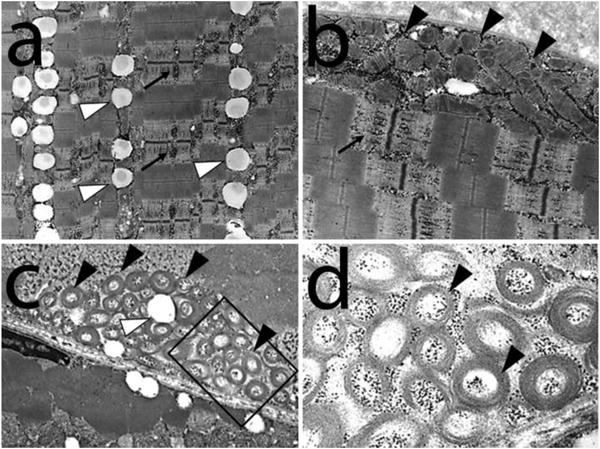
Electron micrographs from the index patient shows a variety of ultrastructural abnormalities in the presence of normal myofibrillar architecture (a-d). Note the accumulation of glycogen (black arrows) and lipids (white arrow heads). There is also an increased number of mitochondria containing abnormal circular cristae (black arrow heads) and marginalization of mitochondria (panels b and c). Selected area (square) from panel (b) is shown in higher power in panel (d).