
Figure 6.
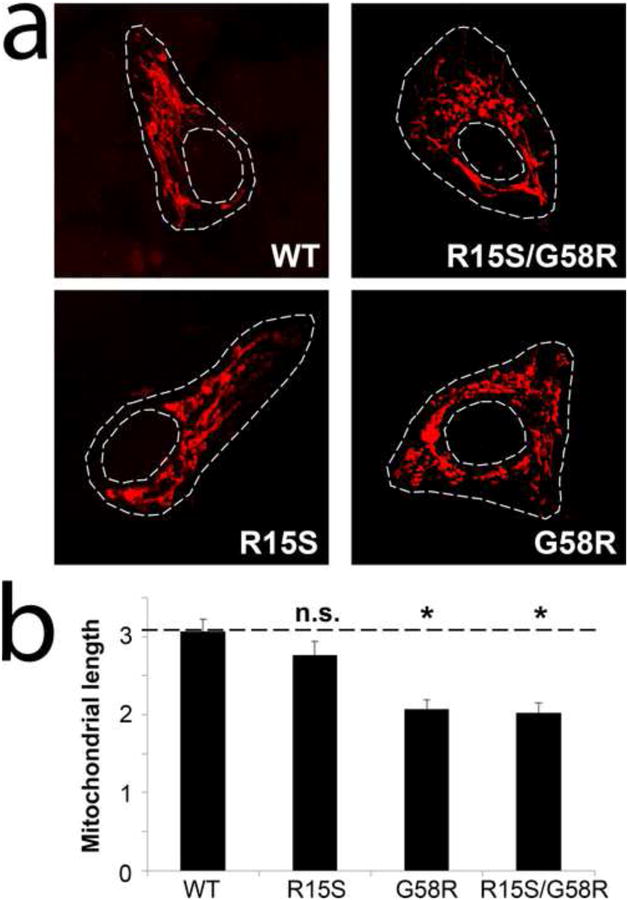
Confocal images of mitochondria labeled by transient transfection of DsRed-Mito in HEK-293 cells expressing either wild-type (WT) or mutant (R15S, G58R or R15S/G58R) CHCHD10 (a). Quantitative image analysis of mitochondrial length is shown in panel (b) (n>10 cells in at least three independent experiments; *, p < 0.05 versus WT; n.s., not significant; error bars represent means ± S.E.)