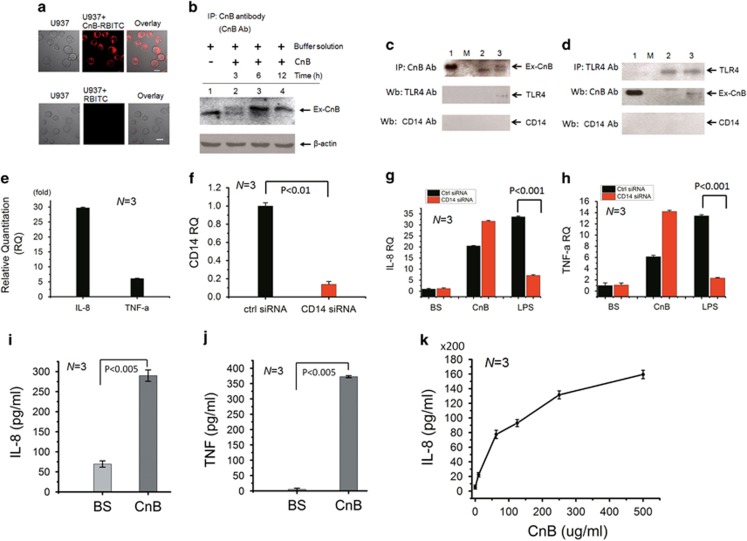
Figure 1.
CnB-induced endocytosis of TLR4 and pro-inflammatory cytokine production are independent of CD14. (a) Confocal microscopy images showing CnB-RBITC and RBITC internalization in U937 cells. (b) Immunoprecipitation analysis of exogenous CnB (Ex-CnB) ingested into U937 cells. Lane 1: U937 cell lysate, the band is the endogenous CnB protein; lanes 2–4: CnB-treated U937 cells at various time points. (c and d) Co-immunoprecipitation (repeated for three times) of exogenous CnB (Ex-CnB) and endogenous TLR4 using exogenous CnB (c) and endogenous TLR4 (d), respectively, as the bait protein, followed by western blotting for CnB, TLR4 and CD14. Lane 1: purified CnB was used as a control added directly to the SDS–PAGE gel; lane M: protein marker; lane 2: buffer solution-treated U937 cells; lane 3: CnB-treated U937 cells. (e) Quantitative PCR of IL-8 and TNF-α, which were normalized to the mRNA transcripts from the buffer solution-treated cells (as a control). (f) Quantitative PCR for CD14 expression in U937 cells transfected with a control siRNA or CD14 siRNA, which were normalized to the β-actin mRNA. CD14 expression was knocked down to 13.9%. (g and h) Quantitative PCR for IL-8 and TNF-α in U937 cells transfected with a CD14 siRNA or control siRNA and treated with CnB, buffer solution (BS) or LPS for 3 h. (i and j) ELISA for IL-8 and TNF-α in U937 cells treated with CnB for 3 h. (k) ELISA for IL-8 in U937 cells treated with different concentrations of CnB (0, 10, 62.5, 125, 250 and 500 μg) for 24 h. The scale bar represents 10 μm in a, and the error bars represent the mean±s.d.

