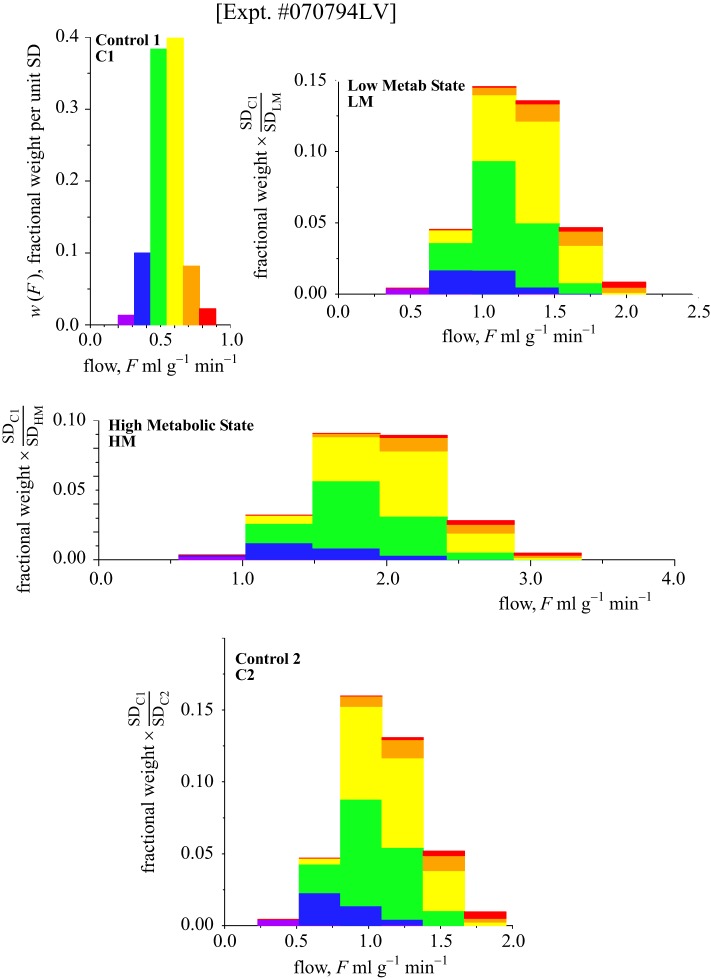
Fig. 2.
Probability density functions [w(F)] for regional myocardial blood flows in an anesthetized dog. Top left, C1; top right, low metabolic stimulation with catecholamine infusion (LM); middle, high metabolic stimulation with catecholamine (HM); bottom, control 2 (C2), which is the second control state, after the catecholamine infusion was stopped, although with a persisting high heart rate. The histograms are color coded for each class with width 1 SD from the first control (C1). The pieces retain their original color code throughout the series of interventions as they change their flows and their relative positions within the histogram. The abscissa is the same in all panels. The area under each probability density function is unity. The ordinate scales are different in each panel. The order of the series was C1, LM, HM, and C2 (at 90 min after C1).

