Fig. 2.
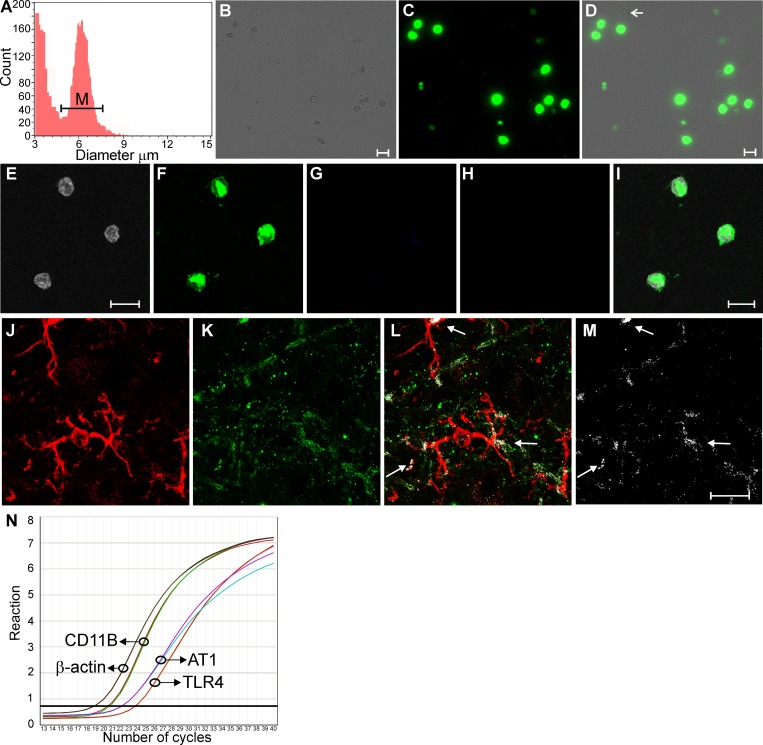
Hypothalamic microglia express ANG II type 1 (AT1) receptors (AT1Rs) and TLR4. A: automatic measurement of cell number and diameter from the extracted cell population by Percol gradient permitting the distinction between microglia (M) and debris. B and C: live isolated cells (phase contrast; B) were stained with Vybrant DyeCycle (C). D: merged image. The arrow points to a representative dead cell. Manual counting showed ∼90% live cells in our samples. E–H: isolated cells (Hoechst counterstaining; E) showed positive immunostaining for microglia (IBA1; F) but not for astrocytes [glial fibrillary acidic protein (GFAP); G] or neurons (NeuN; H). I: merged images from E–H. J and K: confocal photomicrographs showing the microglial marker IBA1 (red; J) and TLR4 (green; K). L: merged image showing the signal colocalization (white pixels). M: only colocalized pixels are shown. N: real-time PCR detection of microglia (CD11B), AT1a, and TLR4 mRNA in isolated hypothalamic microglia. Scale bars = 10 μm (isolated cells) and 20 μm (tissue).

