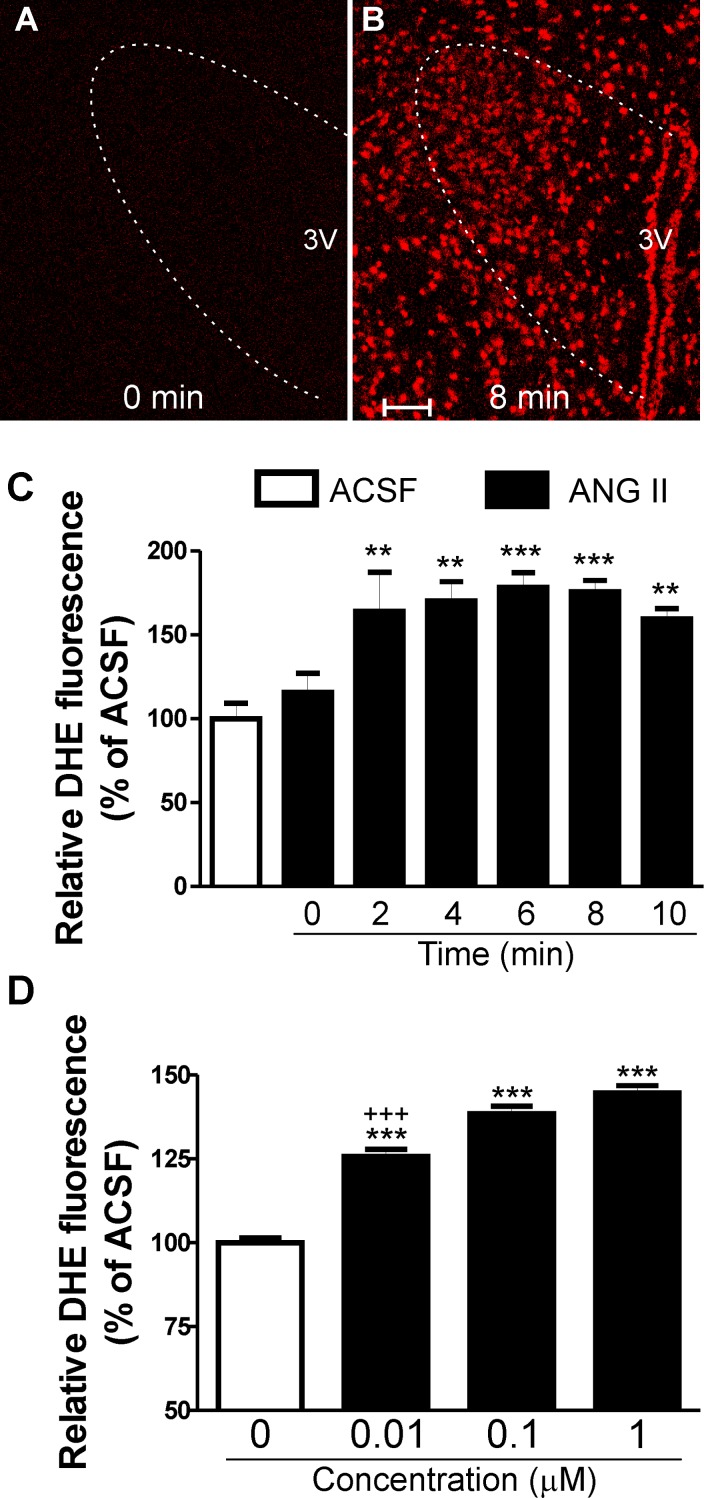
Fig. 3.
ANG II-mediated ROS within the PVN of rats and mice. A and B: photomicrographs of dihydroethidium (DHE) staining in the presence of ANG II (1 μM) obtained at time 0 (A) and 8 min (B) within the PVN of TLR4-sufficient mice. C: mean data representing relative DHE fluorescence (percentage of ACSF) acquired from time 0 to 10 min, sampled every 2 min after ANG II (1 μM) incubation. D: mean data representing relative DHE fluorescence (percentage of ACSF) acquired at 10 min after the beginning of different concentrations of ANG II (0.01, 0.1, and 1 μM) incubation. 3V, third ventricle. Scale bars = 50 μm. n = 8/group. ***P < 0.0001 and **P < 0.001 vs. aCSF; +++P < 0.0001 vs. ANG II (0.1 and 1 μM).

